Project Baselines Show Real Performance Against Expected
In project management, a baseline is a planned schedule, which can be used as a benchmark to measure project performance.
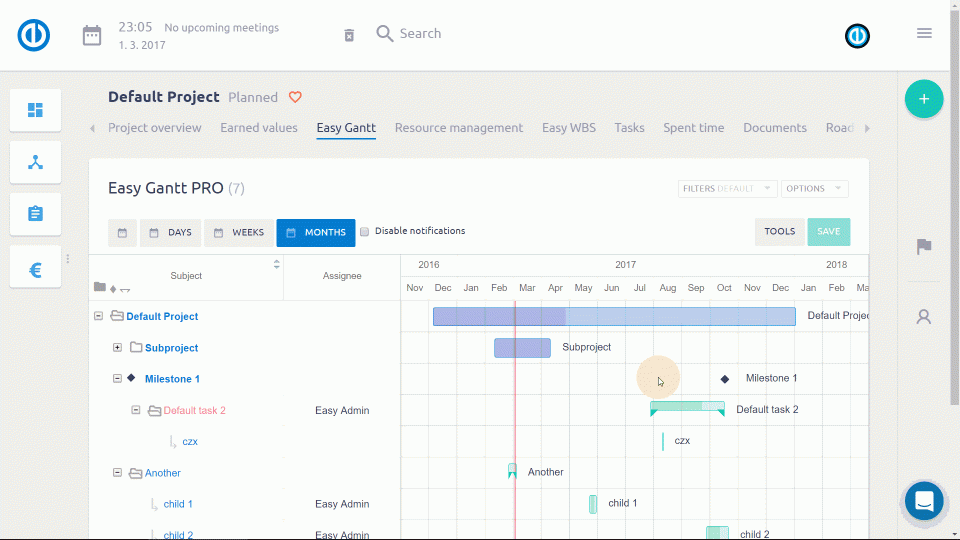
Using project baselines, you can perform analysis to find current performance against the expected level of a specific activity in a specified time phase. Easy Gantt PRO for EasyProject.com provides the functionality of highlighting the baseline plan. The baseline plan does not change when the actual schedule is edited. Easy Gantt chart allows you to create more baselines that work as snapshots of the project's plan at different times. Before starting to use Baselines, you need to have this module enabled in your project settings as shown in the image below.
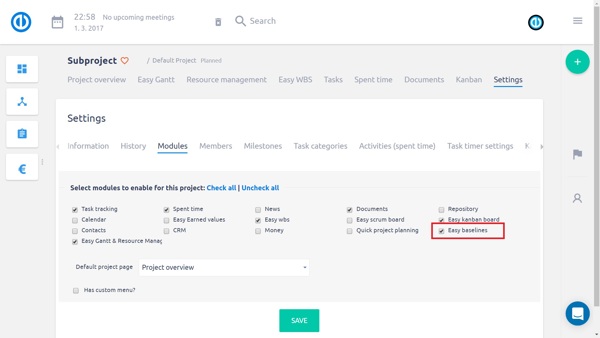
Easy Baselines module
Baselines are easy to create
With this module activated, just open Easy Gantt tab where you can now see the Baselines button in the top right corner of the screen. Click on it, select Create and enter the name of your baseline. Afterward, you see that all the tasks (issues) and milestones (versions) on the Gantt chart have split in two where the upper ones are your current tasks/milestones and the lower ones are the original ones from the time of the creation of the baseline. This way you have a great overview of all the time shifts you made at any point in time.
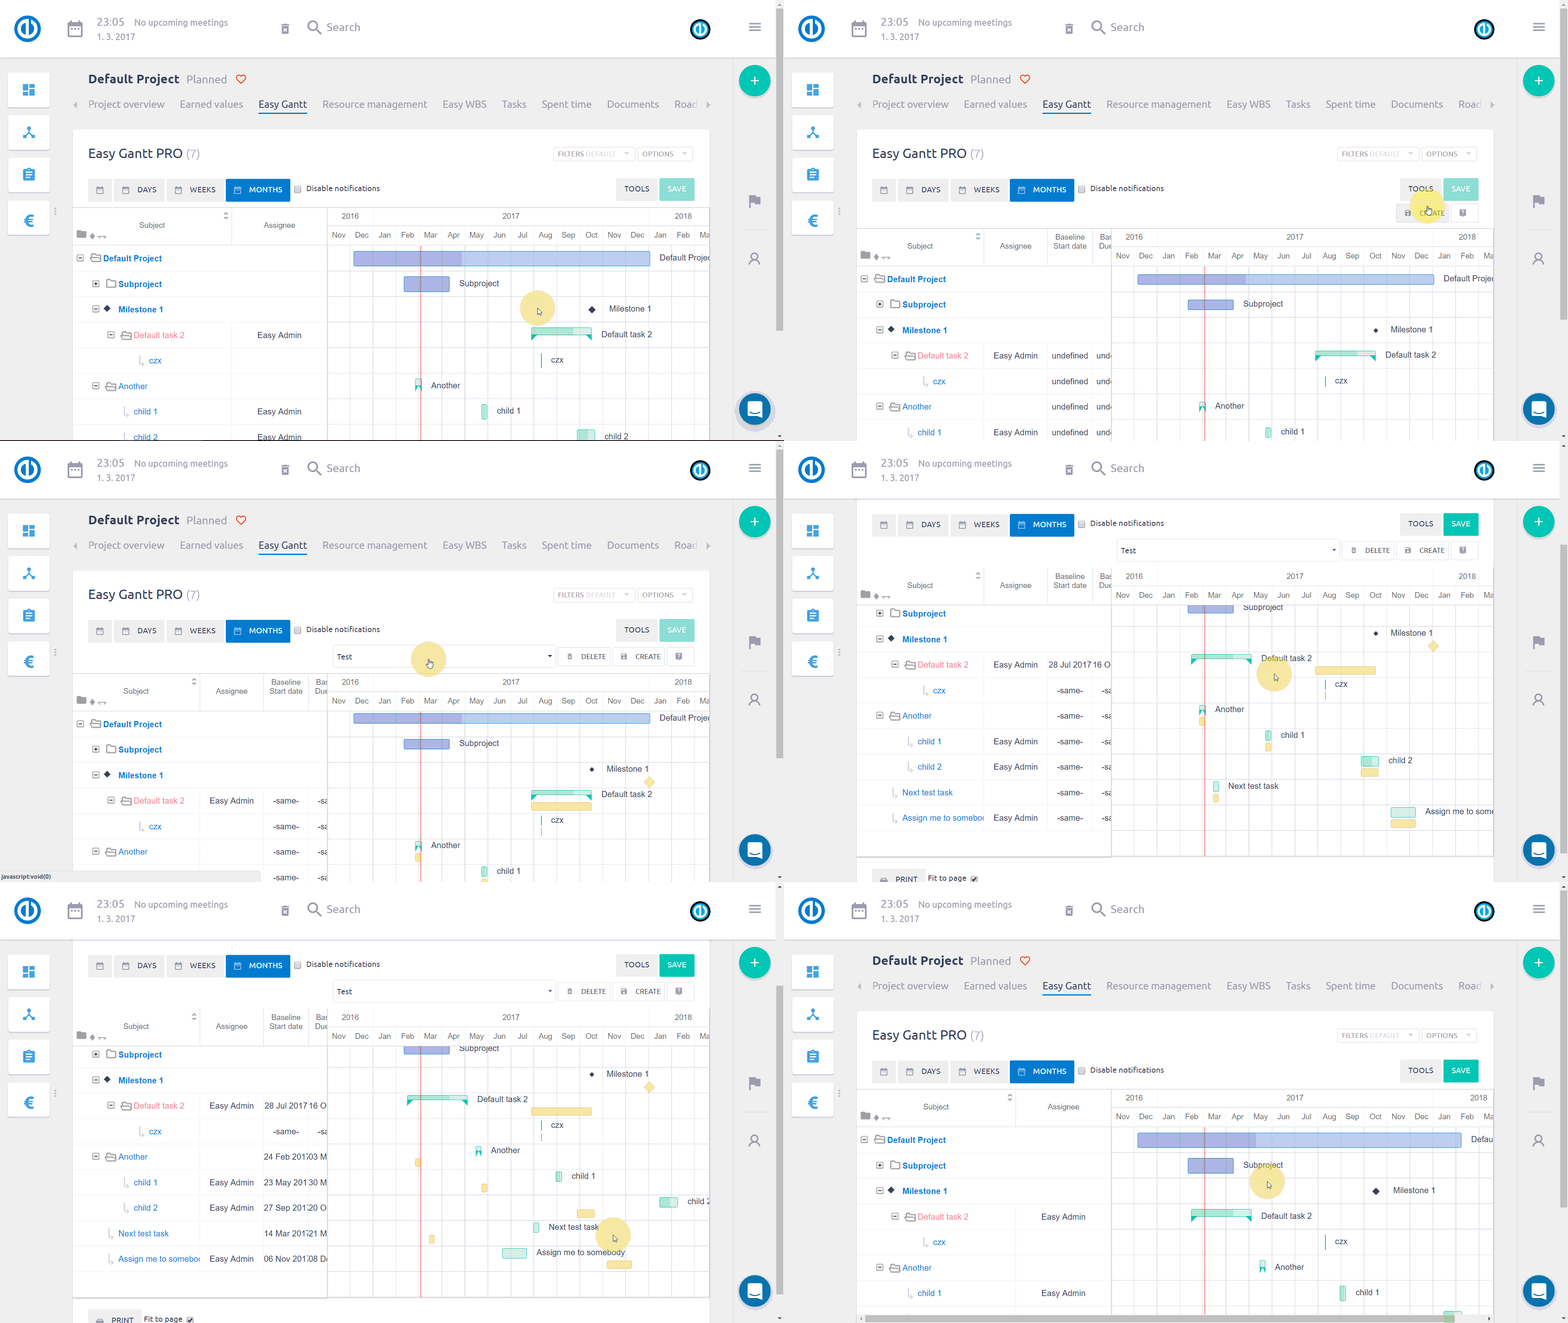
Easy Baselines video
Besides the visual representation of baselines on the Gantt chart, there is also information about the baseline's start date and due date within the particular information columns on the left side of the timeline (as illustrated below). This additional information will come in handy when you need to compare the current start dates and due dates with the original plan (baseline).
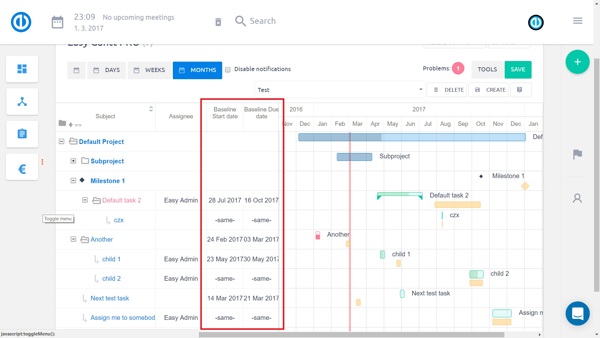
Easy Baselines columns
