Earned value management
Overview
How to access the plugin
How to create a new earned value
How to use the plugin
Manually run recalculation
How to add the plugin to a project overview page and a personal homepage
Roles and permissions
Typical use cases
Earned value management (EVM), or Earned value project/performance management (EVPM) is a project management technique for measuring project performance and progress in an objective manner. In a single integrated system, EVM is able to provide accurate forecasts of project performance problems which are an important contribution to good project performance. It is therefore considered a Performance Management approach.
Overview
Early EVM research showed that the areas of planning and control are significantly impacted by its use; and similarly, using the methodology improves both scope definition as well as the analysis of overall project performance. More recent research studies have shown that the principles of EVM are positive predictors of project success. The popularity of EVM has grown in recent years beyond government contracting, a sector in which its importance continues to rise (e.g., recent new DFARS rules), in part because EVM can also surface in and help substantiate contract disputes.
General facts about EVM
- Earned Value Management = integrated project management approach
- It is the management process that integrates work scope (earned value) with schedule (time) and budget resources (costs)
- A performance management baseline is established to represent a project target ("Planned value")
- Work progress is measured as “earned value” – a yardstick
- Produces a set of metrics that provide accurate cost and schedule amounts
- EVM is not a specific system or a tool set, but rather, a set of guidelines that guide a company’s management control system
Earned Value Management has the ability to combine measurements of the project management triangle
- Scope (in Easy Project, this is represented by Earned value curve)
- Time (in Easy Project, this is represented by the horizontal timeline in an EV chart)
- Costs (in Easy Project, this is represented by Actual costs curve)
EVM provides an answer to these questions
- Is a project on schedule?
- Are the cost spent according to a schedule?
- When will be a project done?
- Will it cost the money I planned?
How to access the plugin
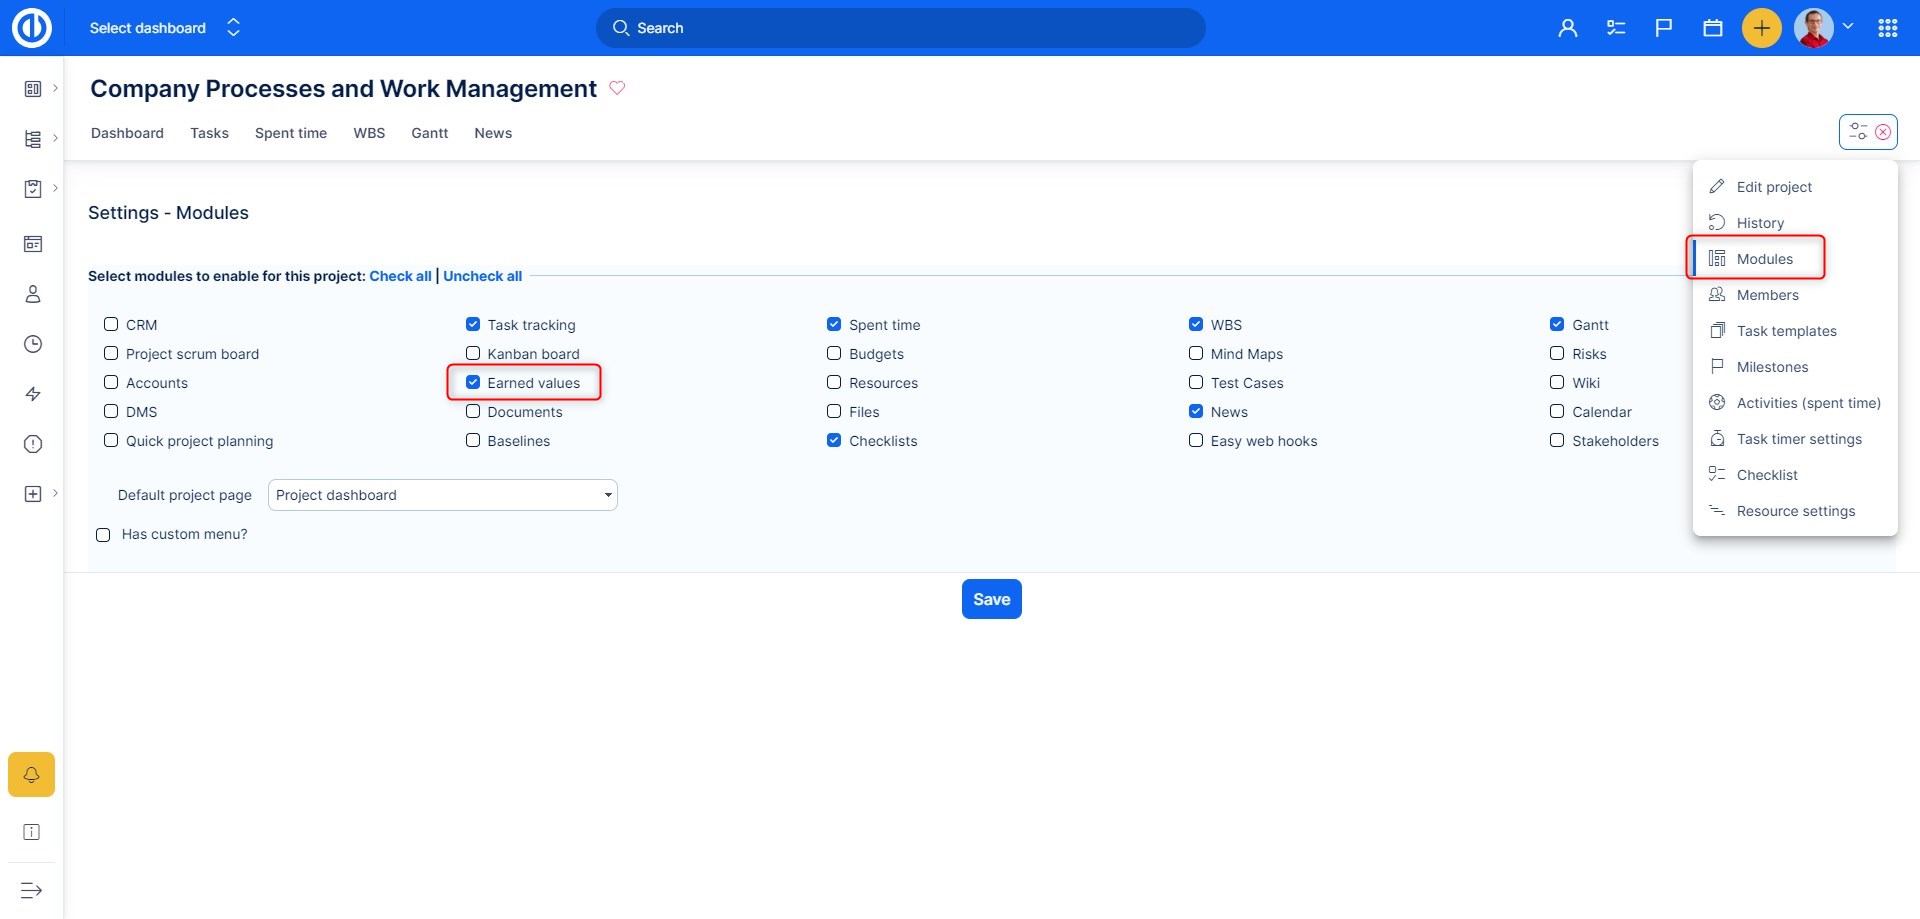
Since Earned Value (EV) is a project-based module only, it needs to be enabled in -Project controls >> Modules. In order to create a baseline of the project plan, which is used to show planned value chart line and compare the actual EVM line with the planned value, and make the plugin show data, Easy Gantt and Easy Baselines modules must be enabled on the project as well. Afterward, you find the module tab in the project's top menu as illustrated below.
How to create a new earned value
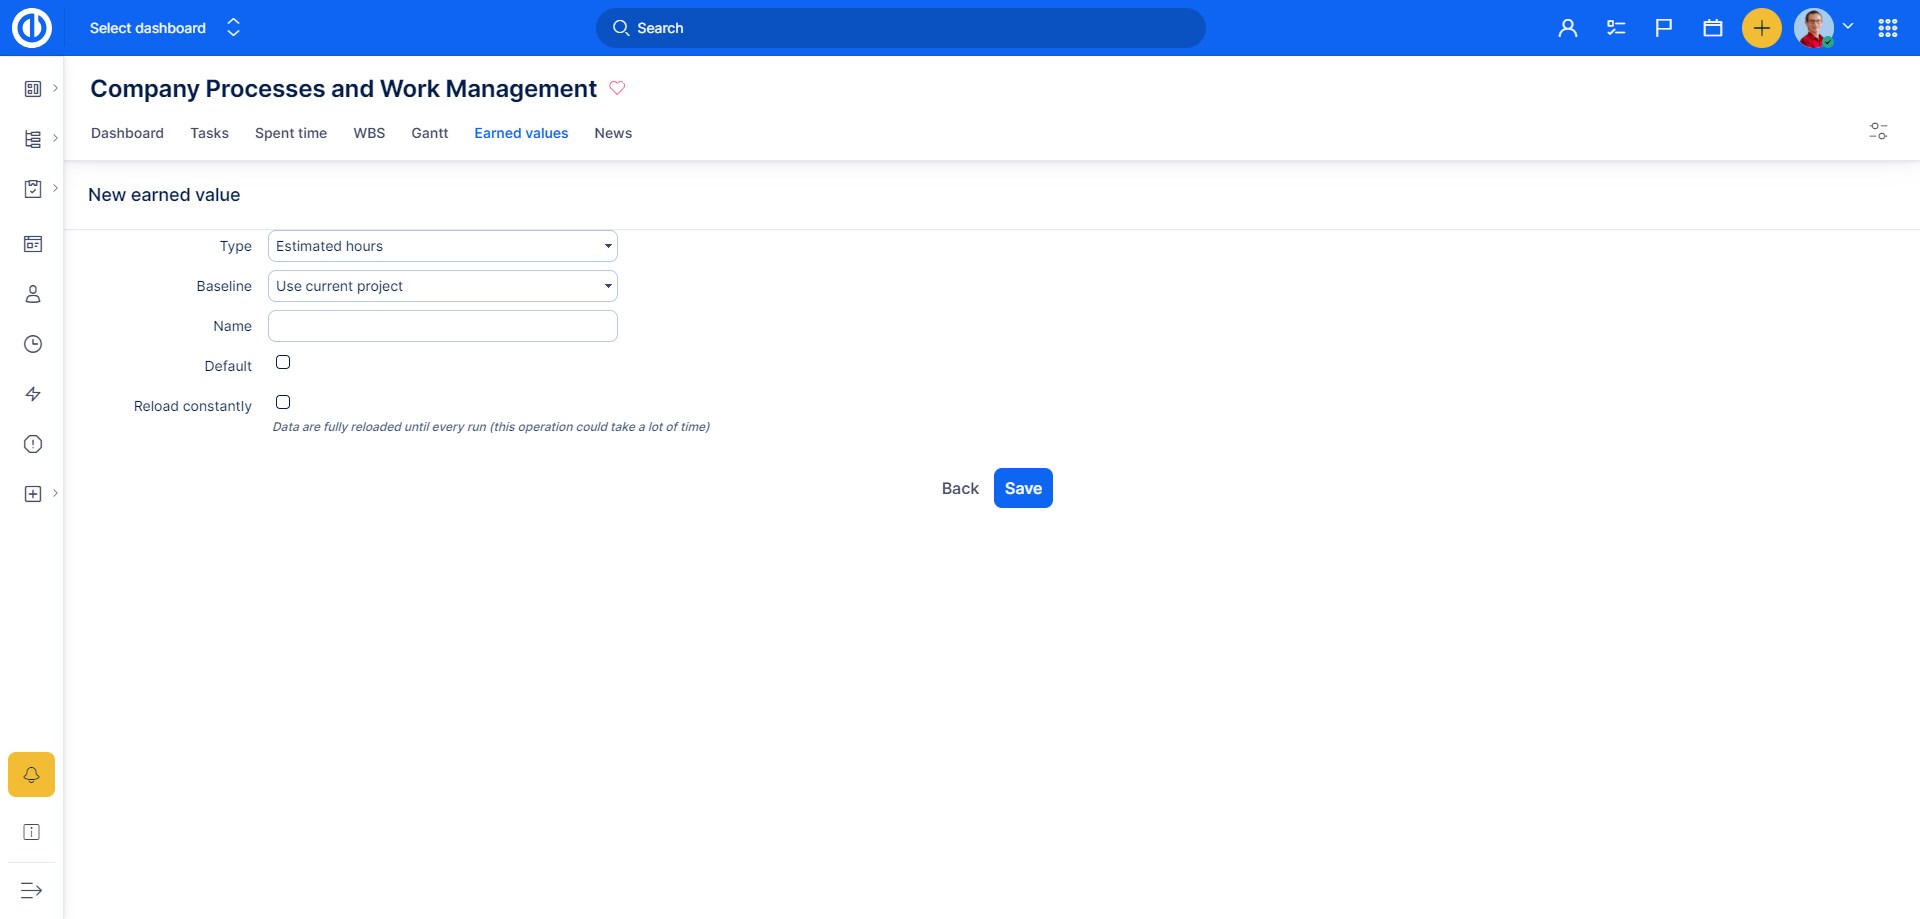
Go to Project controls >> Earned values >> New. Then fill in the mandatory fields:
- Type - select the type of earned value (estimated hours is the only option right now)
- Baseline - select the baseline of your earned value or use the current project state instead
- Name - name your earned value
- Default - tick to make this earned value the default one
- Reload constantly - Data is fully reloaded until every run (this operation could take a lot of time). Cron data is updated every day. This setting means that the data is not updated but everything is deleted and recreated, meaning it just rewrites it from the beginning.
How to use the plugin
Before start working with EV module itself, first it needs to be configured in project's Settings: Earned values. The below image shows how the configuration page looks like. As you can see, there is a list of already created/existing EV charts so you can have an unlimited number of charts and quickly switch between them. Each single chart might use a different baseline which is represented by a Planned value curve in an EV chart so this will be found helpful when comparing different project targets with actual progress. As for any list item (a chart), you can edit or delete it, set one as default (to be displayed by default when there is more than one chart in the list) or create a New one by clicking on the "New" button on the right side.
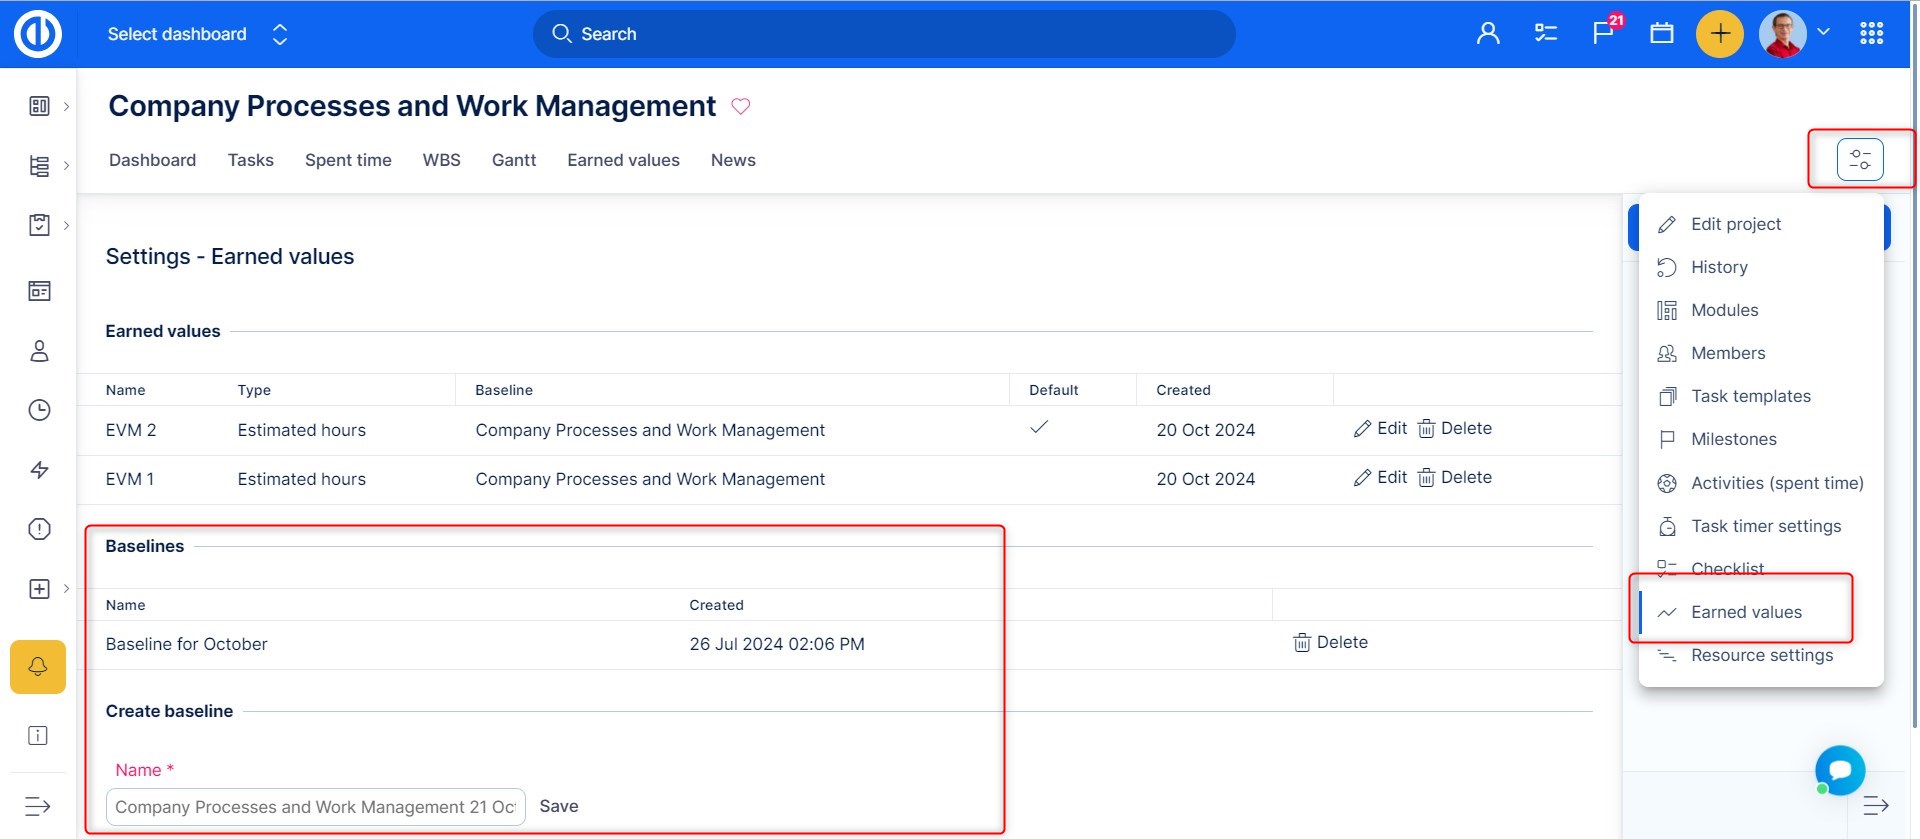
Down on the page, there is a quick option "Create baseline" with the list of already created/existing baselines on the right side. Each baseline has a name, date of creation and can be deleted immediately by clicking on the "Delete" button. A baseline represents your desired project target which is illustrated by the "Planned value" curve on an EV chart. To learn more about baselines, check out this tutorial. Once a baseline is created and you want to use it along with your new or existing EV chart, just select the desired baseline when creating/editing the chart and save. To show data from Earned Value module, open the respective tab in the project's top menu. The result might look like this.
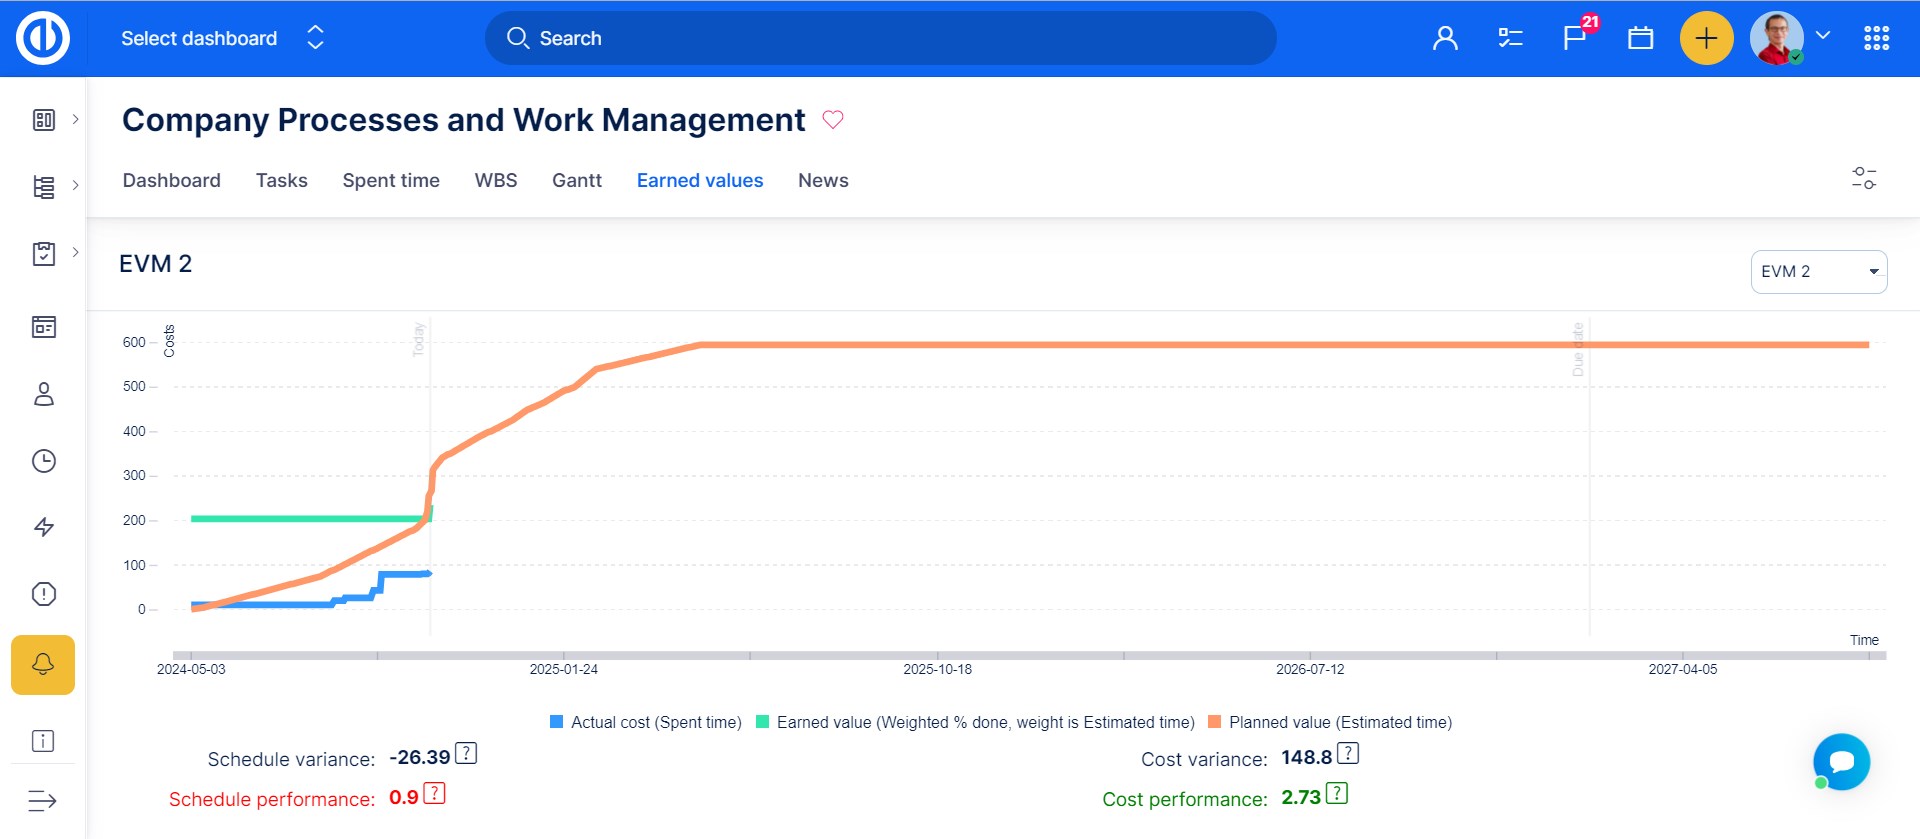
To speak more clearly how the value is to be managed, a number of terms are defined in EVM:
Planned Value (PV) — The approved budget for the work scheduled to be completed by a specified date; also referred to as the budgeted cost of work scheduled (BCWS). The total PV of a task is equal to the task’s budget at completion (BAC) — the total amount budgeted for the task. In Easy Project, this is counted as total estimated time of all project tasks as per selected baseline. Example: at end of week 4, altogether 4 houses should be completed, the PV is US$4000.
Earned Value (EV) — Represents the amount budgeted for performing the work that was accomplished by a given status date, often called the Budgeted Cost of Work Performed (BCWP) and equals the total activity (or project) budget at completion multiplied by the percentage activity (or project) completion (PC) at this particular point in time (=PC*BAC). In Easy Project, this is counted as total percentage done ratio of all project tasks. Example: by end of week 4, only 3 houses are completed, the EV is US$3000.
Actual Cost (AC) — The costs actually incurred for the work completed by the specified date; also referred to as the actual cost of work performed (ACWP). In Easy Project, this is counted as a total amount of time spent on all project tasks. Example: by end of week 4, US$4000 was spent, the AC is US$4000.
EVM is based on monitoring these three aspects of the project in order to reveal the health of the project with the following indices:
Schedule Variance (SV) — the difference between Planned Value (PV) and Earned Value (EV), to tell whether the project work is ahead of / on / behind schedule. The SV shows whether and by how much your work is ahead of or behind your approved schedule.
- Schedule variance (SV) = Earned value (EV) – Planned value (PV)
- If the project is behind schedule, the SV will be negative (i.e. achieved less than what planned)
- If the project is on schedule, the SV = 0
- If the project is ahead of schedule, the SV will be positive (i.e. achieved more than what planned)
- example: by end of week 4, the SV = EV – PV = US$3000 – US$4000 = -US$1000 (behind schedule)
Schedule Performance (SP) — the ratio between EV and PV. The SP reflects the relative amount the project is ahead of or behind schedule, sometimes referred to as the project’s schedule efficiency. You can use the SP to date to project the schedule performance for the remainder of the task.
- Schedule performance (SP) = Earned value (EV) / Planned value (PV)
- If the project is behind schedule, the SP < 1 (i.e. achieved less than what planned)
- If the project is on schedule, the SP = 1
- If the project is ahead of schedule, the SP > 1 (i.e. achieved more than what planned)
- example: by end of week 4, the SP = EV/PV = US$3000/US$4000 = 0.75 (behind schedule)
Cost Variance (CV) — the difference between EV and AC, to tell whether the project work is under / on / over budget. The CV shows whether and by how much you’re under or over your approved budget.
- Cost variance (CV) = Earned value (EV) – Actual cost (AC)
- If the project is over budget, the CV will be negative (i.e. achieved less than spent)
- If the project is on budget, the CV = 0
- If the project is under budget, the CV will be positive (i.e. achieved more than spent)
- example: by end of week 4, the CV = EV – AC = US$3000 – US$4000 = -US$1000 (over budget)
Cost Performance (CP) — the ratio between EV and AC. The CP reflects the relative value of work done compared to the amount paid for it, sometimes referred to as the project’s cost efficiency. You can use the CP to date to project the cost performance for the remainder of the task.
- Cost performance index (CP) = Earned value (EV) / Actual cost (AC)
- If the project is over budget, the CP < 1 (i.e. achieved less than spent)
- If the project is on budget, the CP = 1
- If the project is under budget, the CP > 1 (i.e. achieved more than spent)
- example: by end of week 4, the CP = EV/AC = US$3000/US$4000 = 0.75 (over budget)
The range of the chart is set by the start date and due date + 20 % of the project. It also highlights Today and the Due date.
Manually run recalculation
In Administration >> Overview of scheduled tasks >> Earned value updater, you can manually run and calculate the new state of project = Actual cost line and Earned value line. And you will compare these lines to the planned value line that was generated when setting up EVM on the project. The recalculation is done not only for the current day but applies all past changes on the project as well. That is what the setting Reload constantly does. If you keep the box unchecked, it will work as previously - on every recalculation only use changes made for the current day.
How to add the plugin to a Project Dashboard and My Dashboard
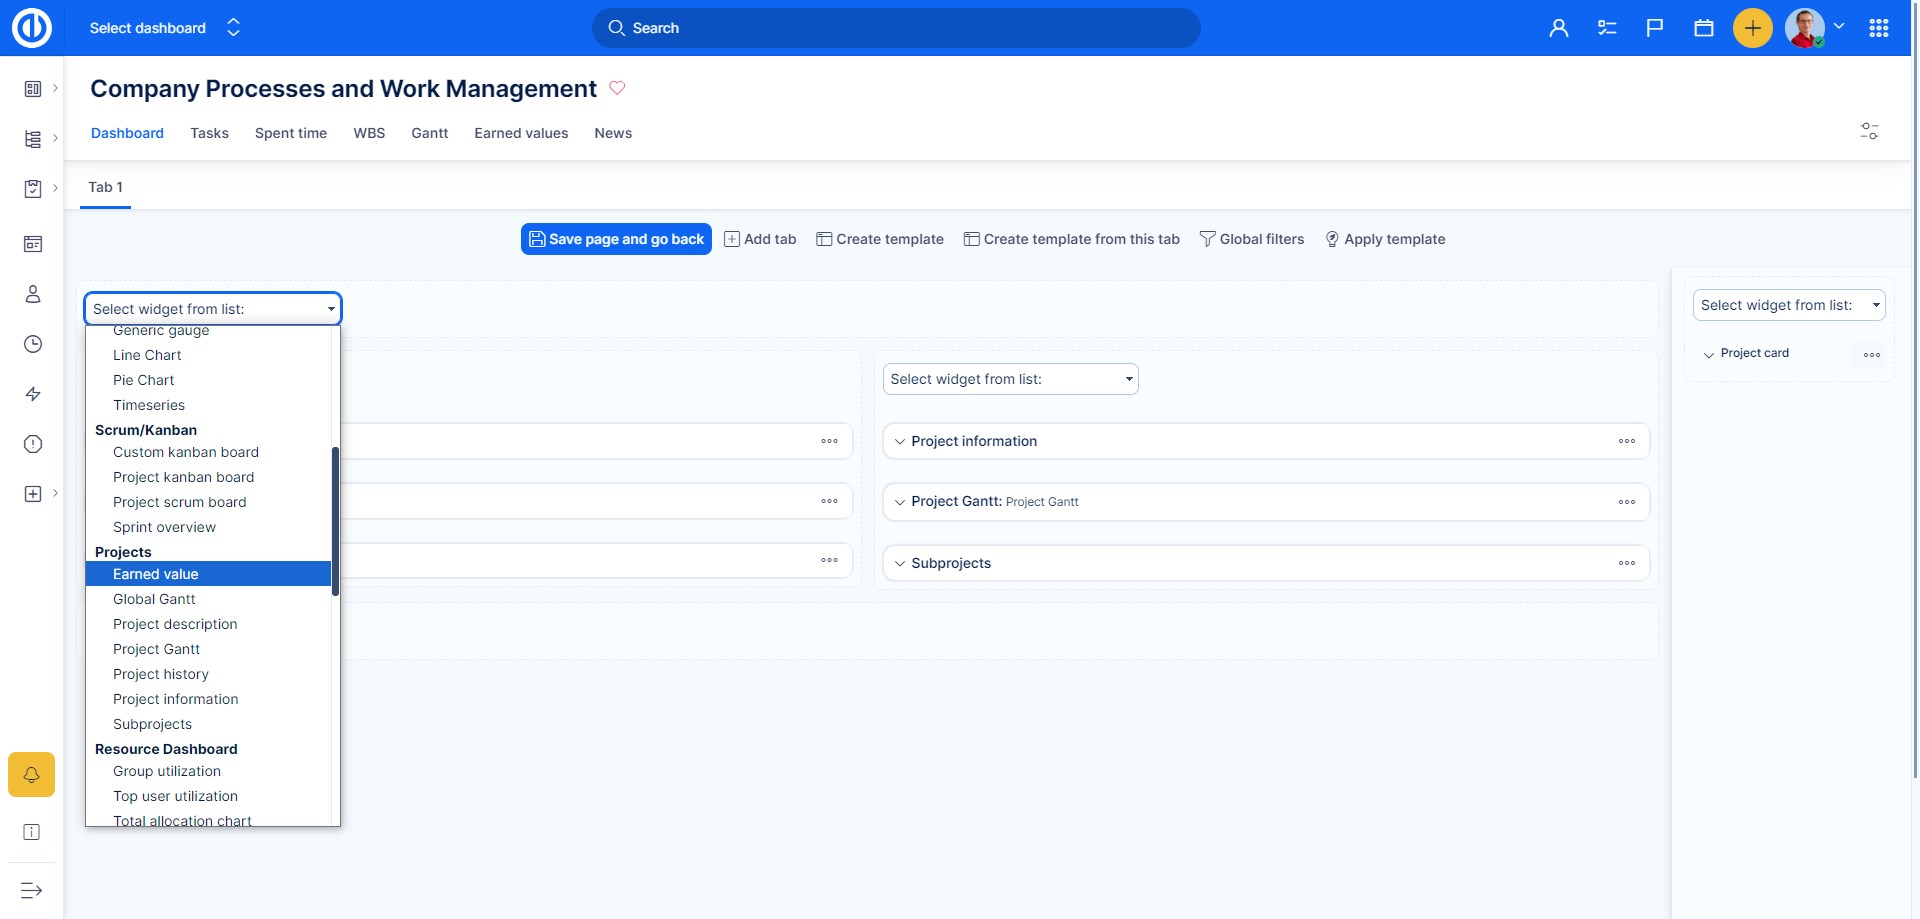
You can simply customize your Dashboard and Project Dashboard by entering the edit mode by clicking on the "Customise this page" button down on the left of the particular page. Here you select widgets to be placed in various sections of the page. To add "Earned Value" widget on a page, just select it from the drop-down list as shown below and save.
Roles and permissions
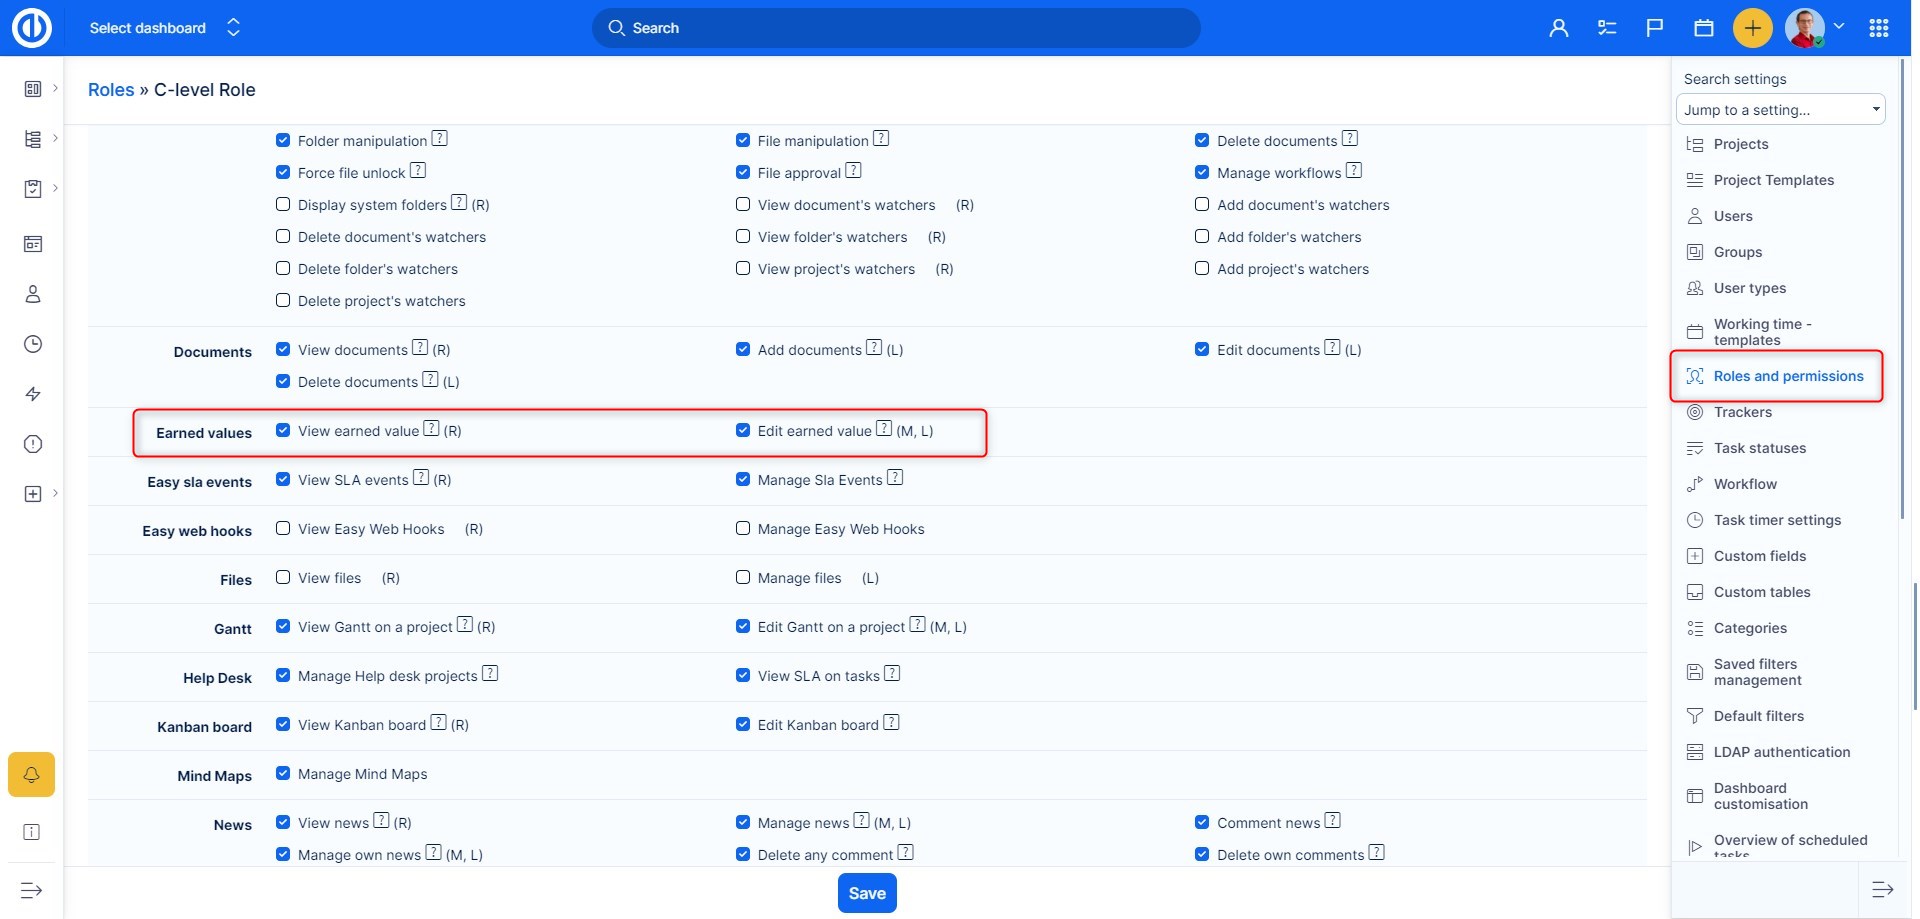
The permissions to view or edit data in EV module can be set in Global menu >> Administration >> Roles and permissions - select a role - Easy Earned values as illustrated below. Additionally, you need permissions to view and edit baselines in order to define Planned value.
Typical use cases
Project A has been approved for a duration of 1 year and with the budget of X. It was also planned that the project spends 50% of the approved budget in the first 6 months. If now 6 months after the start of the project a Project Manager would report that he has spent 50% of the budget, one can initially think, that the project is perfectly on plan. However, in reality, the provided information is not sufficient to come to such a conclusion. The project can spend 50% of the budget, whilst finishing only 25% of the work, which would mean the project is not doing well; or the project can spend 50% of the budget, whilst completing 75% of the work, which would mean that project is doing better than planned. EVM is meant to address such and similar issues.
