Filters 1.0
How to create, apply, save and share Filters 1.0
Introduction
How to work with custom filters
How to work with default filters
Saved filters management
How to work with filters used by widgets in dashboard personalization
Filtering with OR operator
Options
Corner situations
Dynamic filters
Introduction
Filters are a useful tool to improve your listings by displaying only items you are looking for. With the help of filters, you can find anything easier and quicker way, saving your time and effort. Filters are available throughout entire Easy Project and can be used with any kinds of data represented as lists, calendars or charts. You can save them for future use and share with others as well.
The entities of Easy Project for which a filter can be set include:
Easy buttons, Tasks, Task Gantt, Projects, Project Gantt, Project templates, Users, Milestones, Attendance, Time entries, Task timers, Agile Board, Budget sheet, Cash desk, Cash desk records, Contacts, Groups of contacts, CRM cases, CRM case items, CRM contacts, Helpdesk - projects, Knowledge, Planned expenses, Planned revenues, Real expenses, Real revenues, Travel costs, Travel expenses, Projects budget overview, Cash flow, Personal finances, Templates of personal finance, Export templates, Attachments, Timesheets, Resource allocation, Resource allocation by project
You can create both custom filters and default filters. At first, let's take a look at custom filters.
How to work with custom filters
Custom filters are any filters except system default ones. That means you must apply them manually every time you need them. Before you can set a custom filter, you must create one. To do that, open any of the listed entities in Easy Project, such as task list, and click on Filters default in the upper right corner. Now you have to select one or more filters that will apply simultaneously. An example filter may look like this.
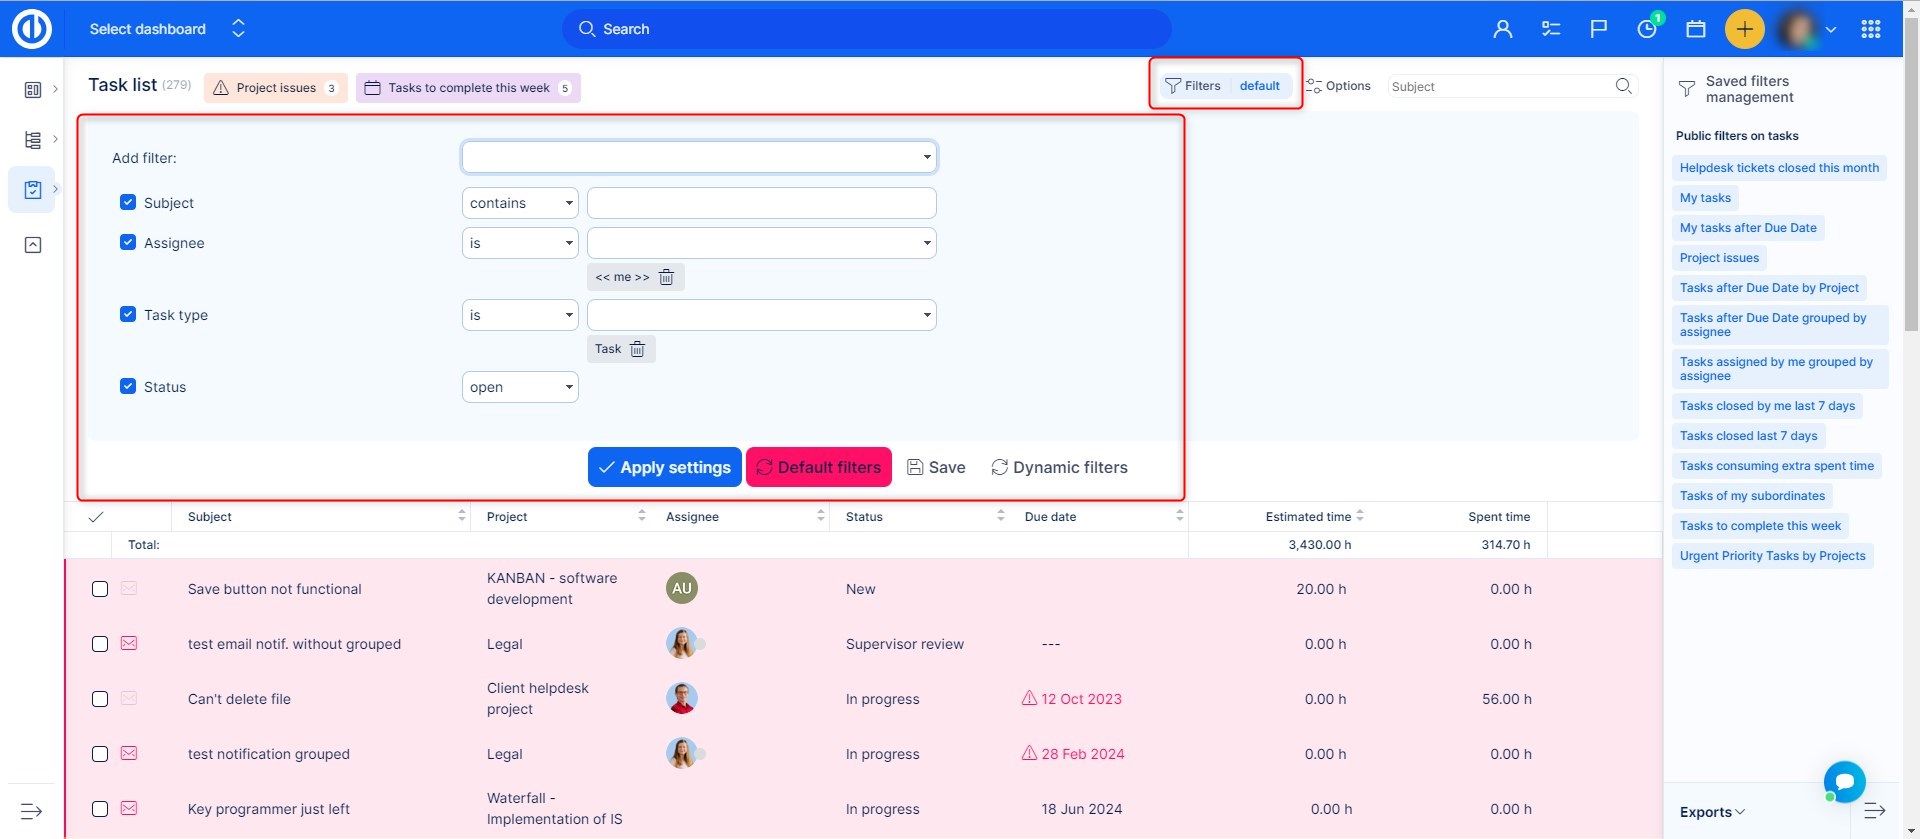
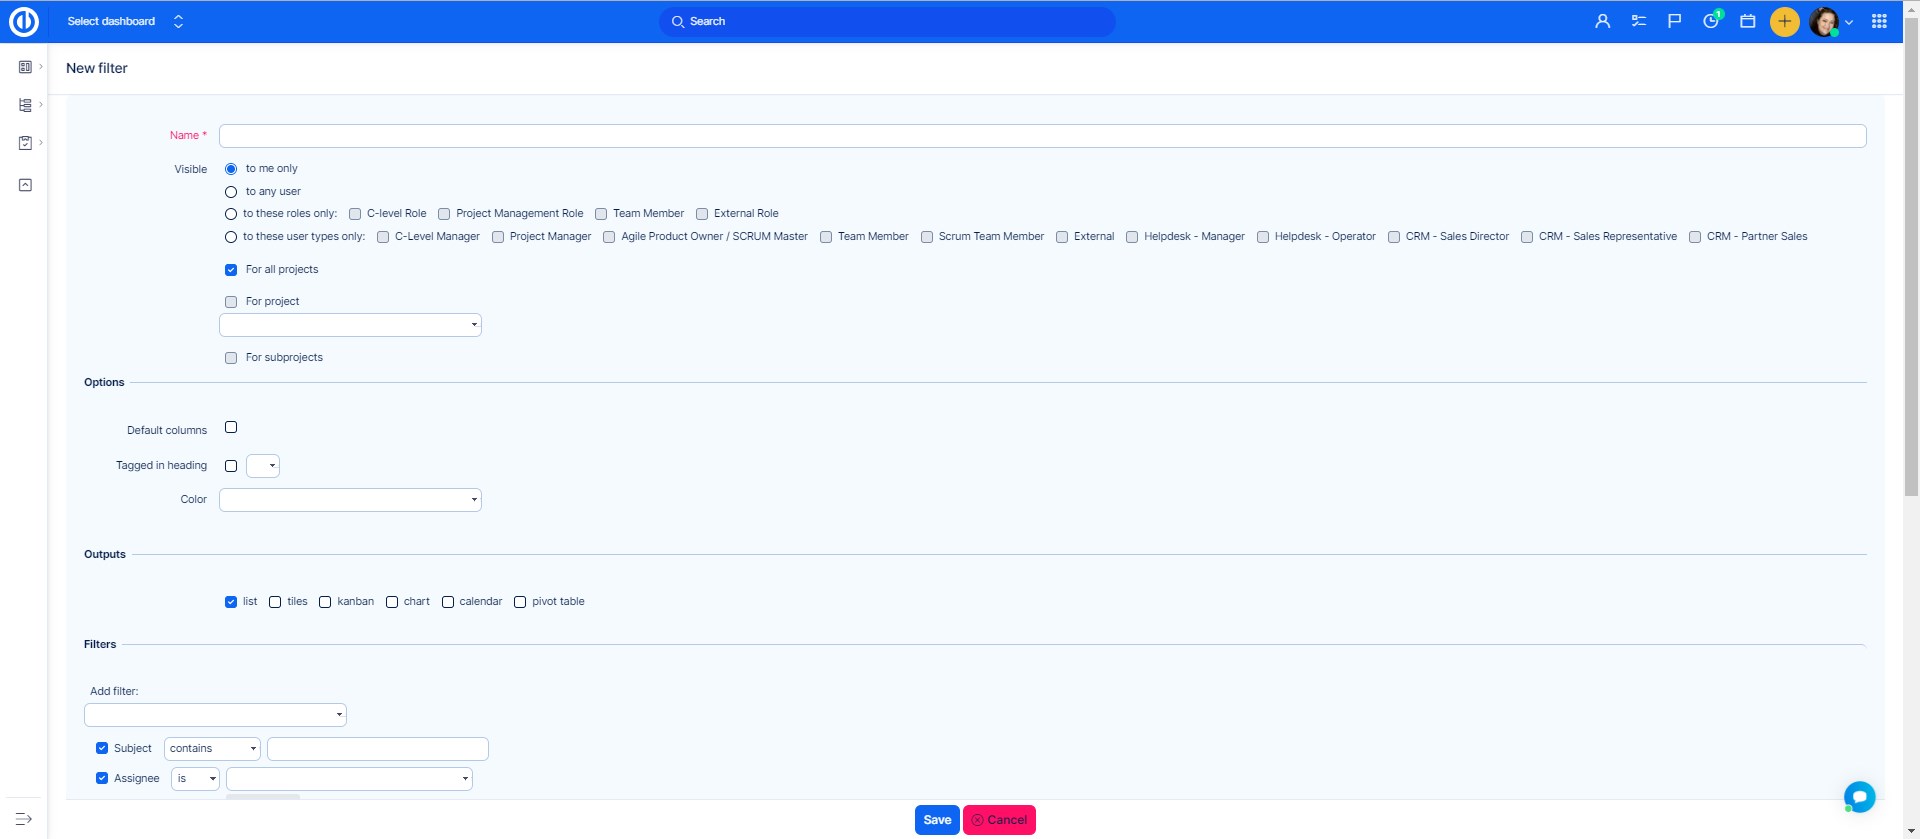
Now you have created your custom filter and should decide whether you need it just for this time, or you prefer to save it for future reuse. In the first case, click on Apply button and the filtered results will show immediately. In the other case, click on Save button and you get into New filter settings with several options to set, including:
- Name (name of your filter)
- Visible to (choose if the filter can be seen and used by you only (private filter), any user (public filter), specific roles and all projects/subprojects)
- Default columns (if ticked, filter will show default columns such as ID, Project, Subject, Assignee, Due date and % Done; otherwise, you select which columns to show)
- Tagged in heading (choose how the filter tag will look like via the icon and color selection)
- Output (choose if the filtered results will show as a list, tiles, chart, calendar, report, Kanban or all of these options)
- Filters (our filters as you already set up in the previous step)
- List/Calendar/Row (based on the previous setting of Output, choose criteria of sorting and grouping of filtered results)
List options include:
- Sort (choose criteria based on which the results will be sorted in the first, second and third order, also set the order ascending or descending)
- Group results by (results can be grouped by selected criteria, such as priority, project, user, due date etc.)
- Show total row (shows a row with total values, such as sums)
- Load groups opened (groups of results will expand so you will see their sub-items right away)
- Show avatars (shows personal user avatars, i.e. little profile images)
Tiles options include:
- no options available
Chart options include:
- Choose chart renderer (type of chart - line, bar, pie)
- X axis (only if results are not grouped, otherwise X-axis is the same as column by which query is grouped)
- Y axis (either shows count of grouped entities or sum of selected criteria, such as estimated time)
- Time window (the time horizon displayed on the chart) + Default period (shows a period of time per day, week, month, quarter or year)
Calendar options include:
- Calendar period (shows a period of time on weekly or monthly basis)
Report options include:
- Group by on top (any task field)
- Group by on side (any task field)
- Sumable column (price or story points)
- Count (check or uncheck to see the total count row)
Kanban options include:
- Kanban grouped by (status or task type)
- Subtitle (any task field)
- Value info (price or story points)
- Additional options (avatar, date, icon)
When settings si completed, it might look like this.
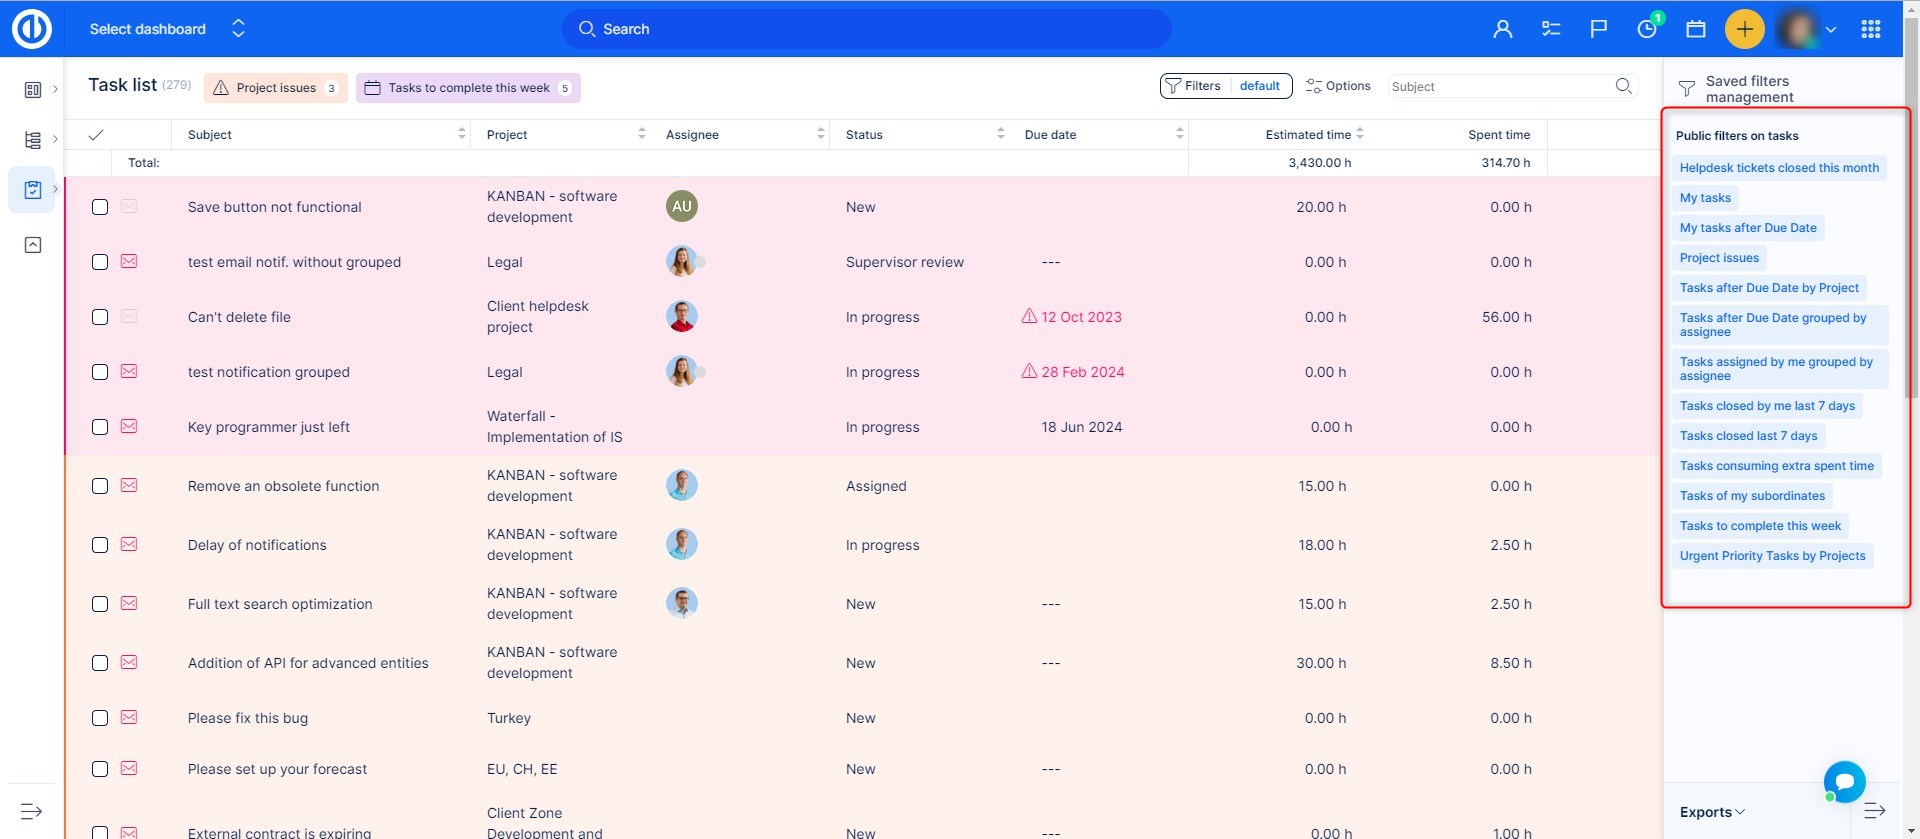
Now, clicking on the Save button will save the filter and show you immediate results that match your filter settings. You can see the filter above when it is saved as a tag, and you can activate it just by clicking on. Moreover, your filter also appears in the right menu "Public filters on tasks" under its name ("My filter"). When it's public, every user will find it here as well. Whenever you click on it, the filter activates. You can easily recognize whether the filter is active by sign "Filters active" on the right beside the tag. To go back to default filter, just click on "Filters active" and then "Default filters".
How to work with default filters
Default filters are those set as system default and they are active every time when no custom filters are active. To edit settings of default filters, go to Global menu >> Administration >> Default filters. In the heading, select a particular entity for which you need to edit the filter. For example, you need to edit default filter on Tasks. So click on the appropriate tab and you get onto settings page, which is very similar to the one used to create a custom filter. There are the following options:
- Add filter (select one or more filters that will be applied simultaneously)
- Default custom formatting (choose if a specific custom formatting scheme will activate along with the filter)
- Default columns (choose columns from the list that will show as default and move them to the right field)
- Group results by (results can be grouped by selected criteria, such as priority, project, user, due date etc.)
- Sort (choose criteria based on which the results will be sorted in the first, second and third order, also set the order ascending or descending)
- Show total row (shows a row with total values, such as sums)
- Load groups opened (groups of results will expand so you will see their sub-items right away)
- Show avatars (shows personal user avatars, i.e. little profile images)
When settings si completed, it might look like this.
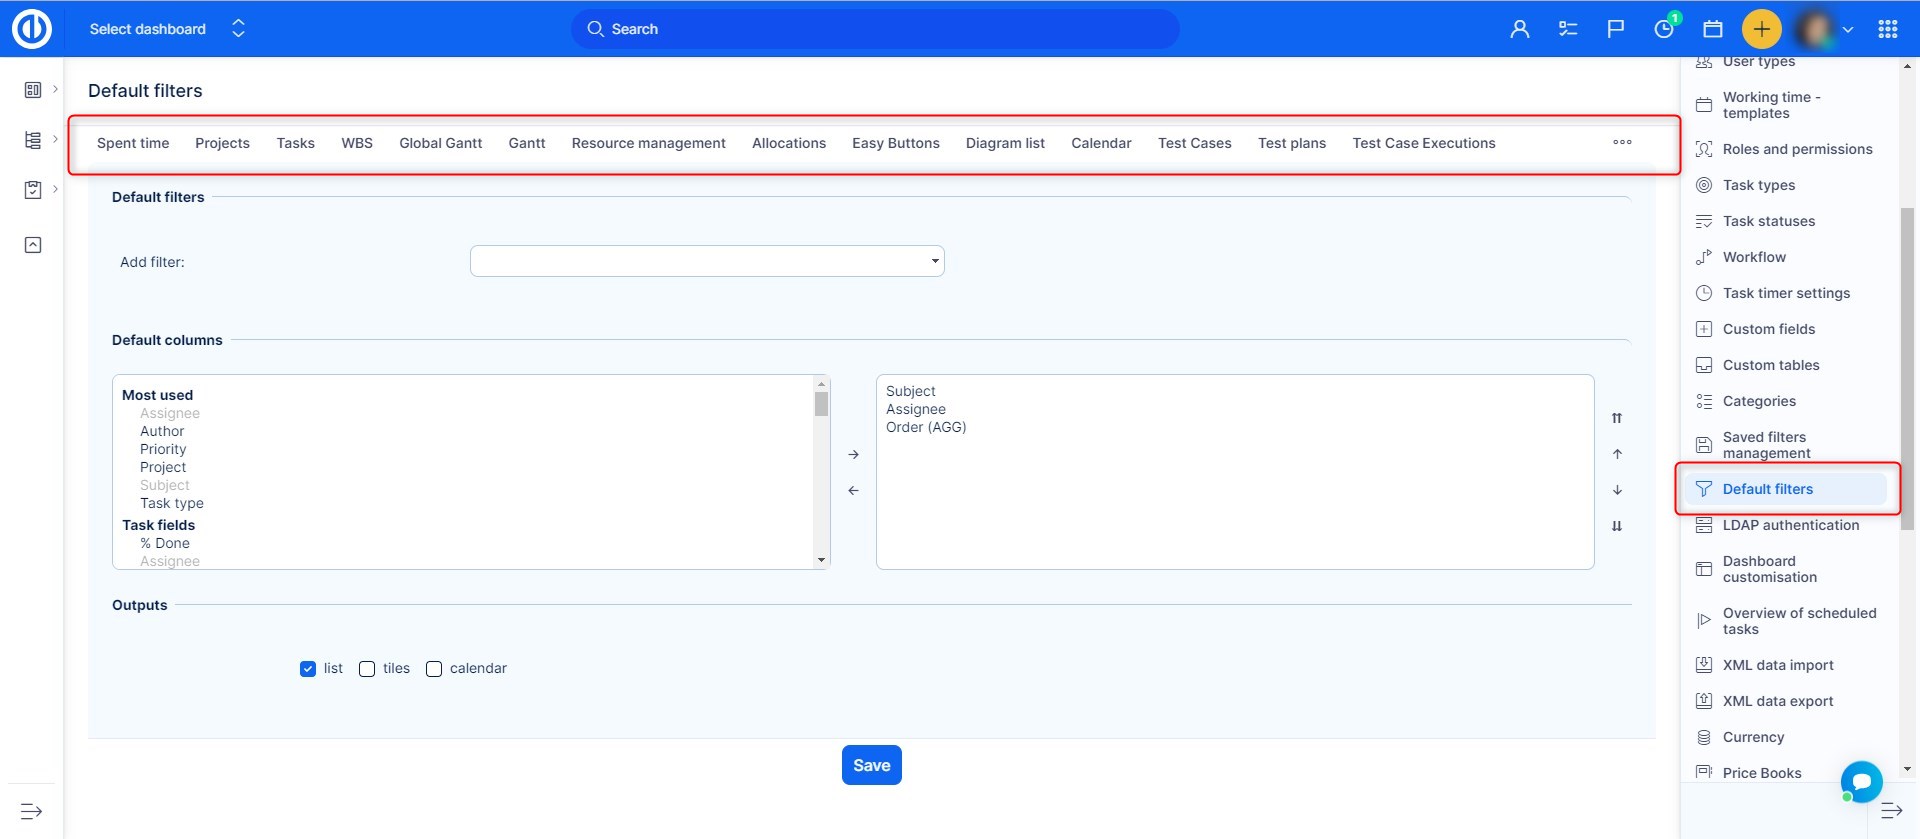
Now, when you save the filter and go to Tasks, you will find the list of items filtered according to these criteria (if no custom filter is active). When editing default filter of some other entity, there might be little different setting options, however, they are all very similar to those already described.
Saved filters management
To see and manage all saved filters, go to Administration >> Saved filters management.
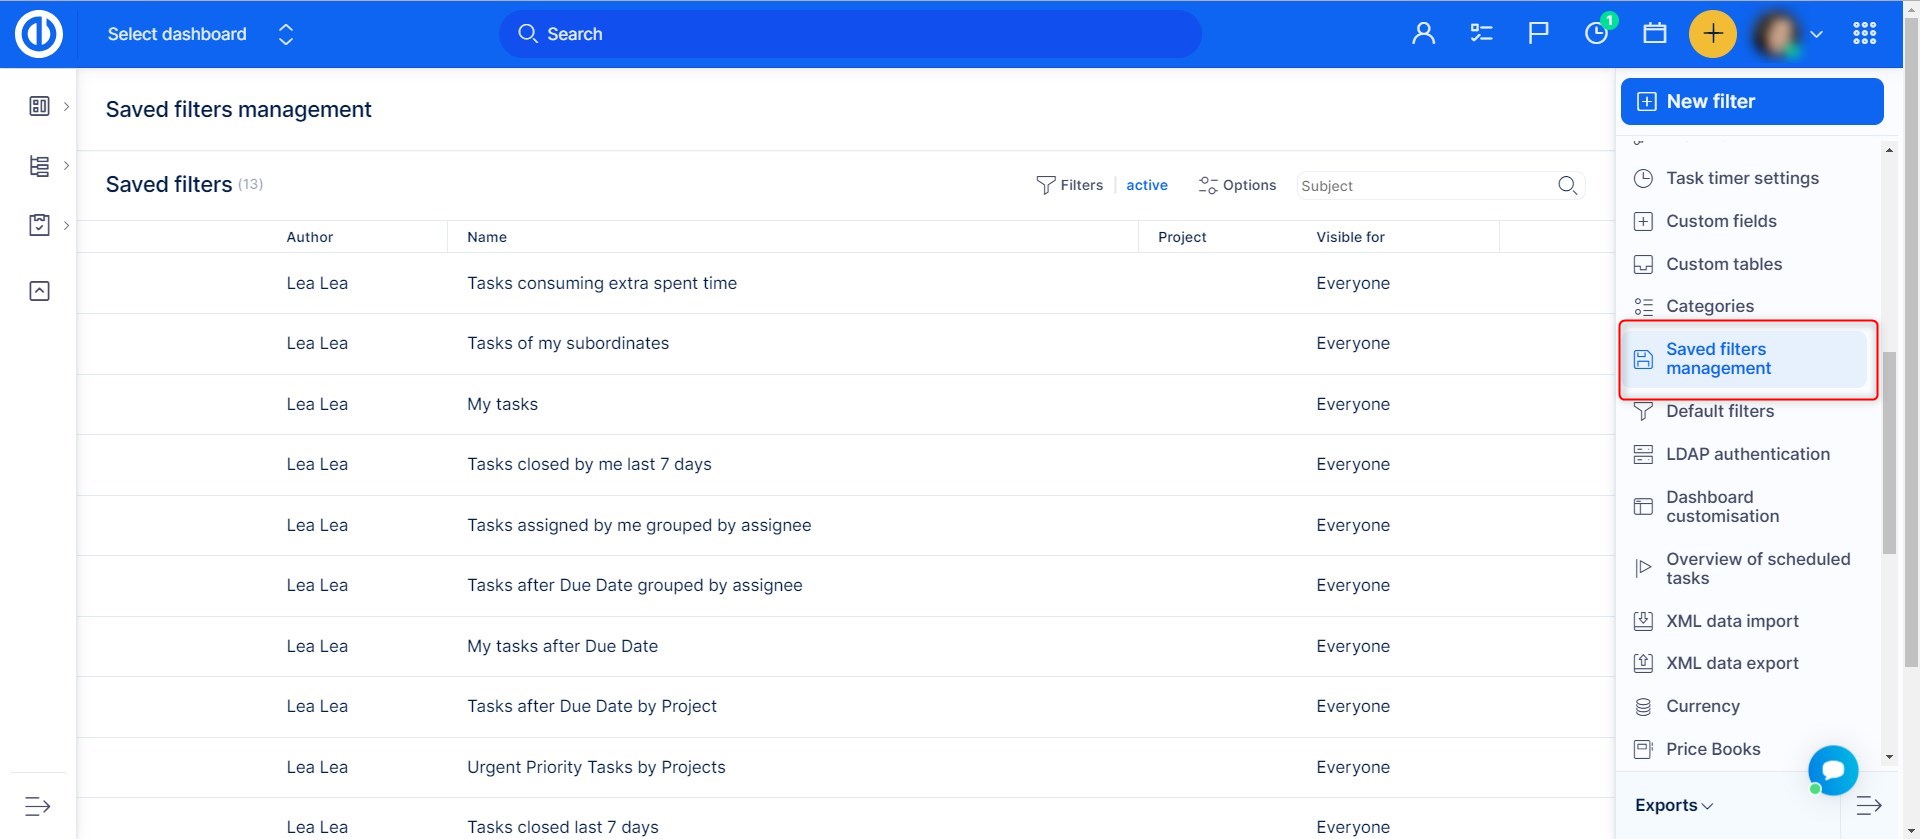
Here you will find all saved filters in the system. this view is only available to Admins.
You will be able to filter through the filters by author, project, name and visibility and entity type.
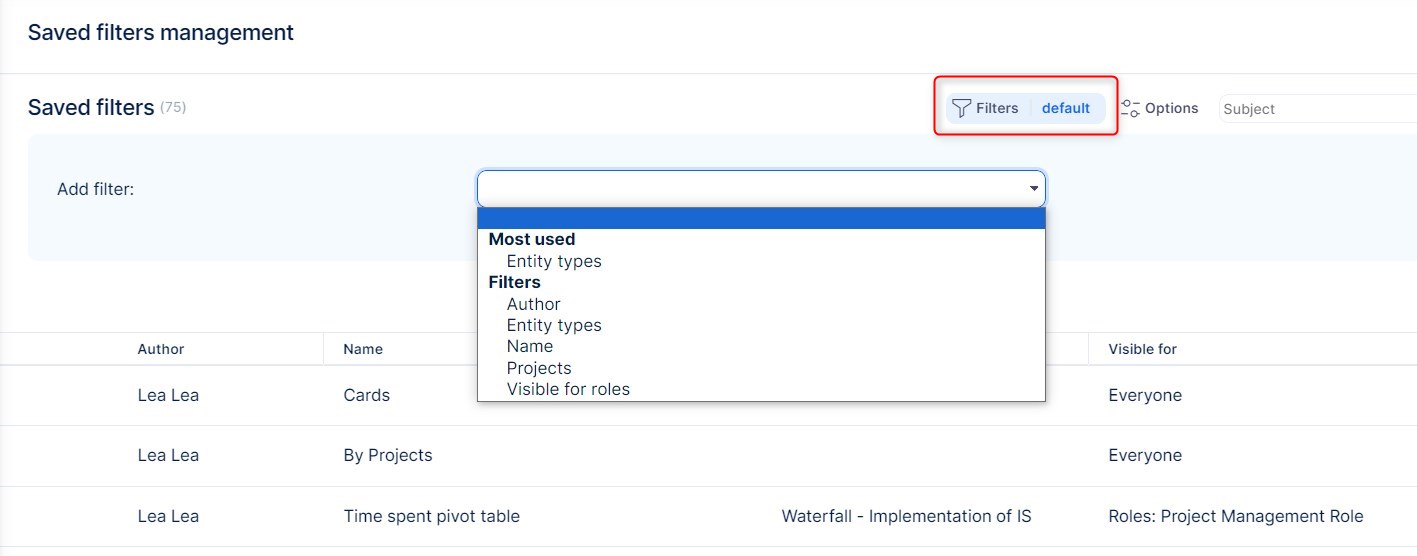
Filters can be deleted or edited from this view via these options:

You will be also able to create a new filter from this v iew, to do so click the New filter button.

Then select an entity and click create.
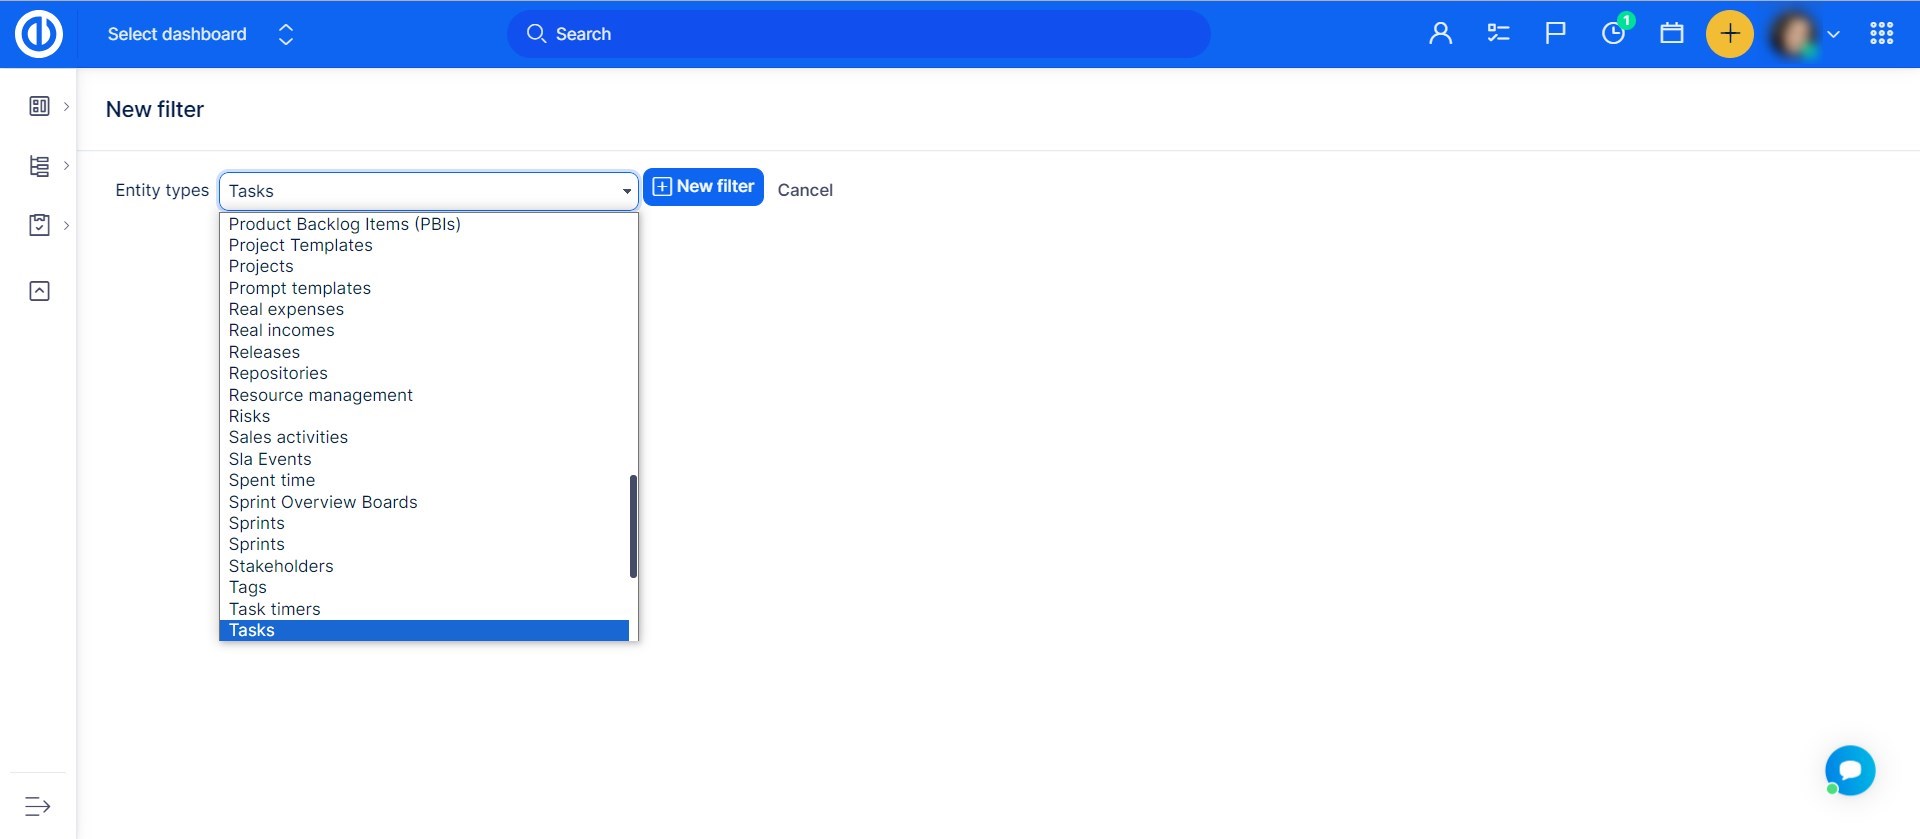
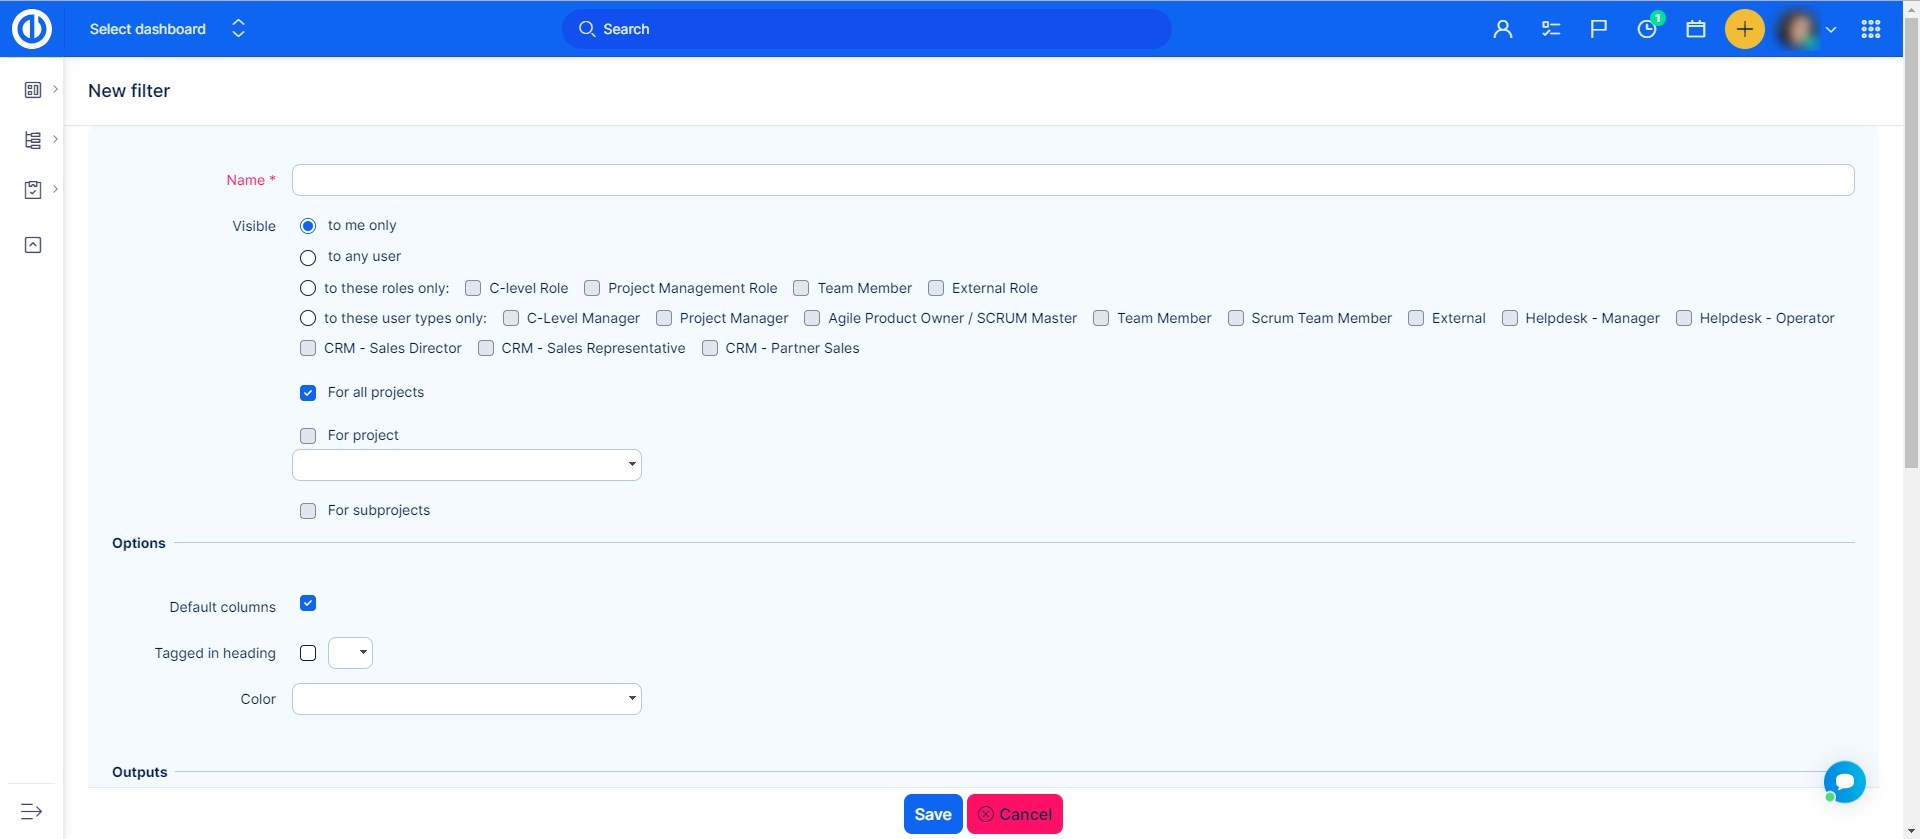
You will be taken to this view where you set up the filter and specify where and to whom to show it.
How to work with filters used by widgets in dashboards personalization
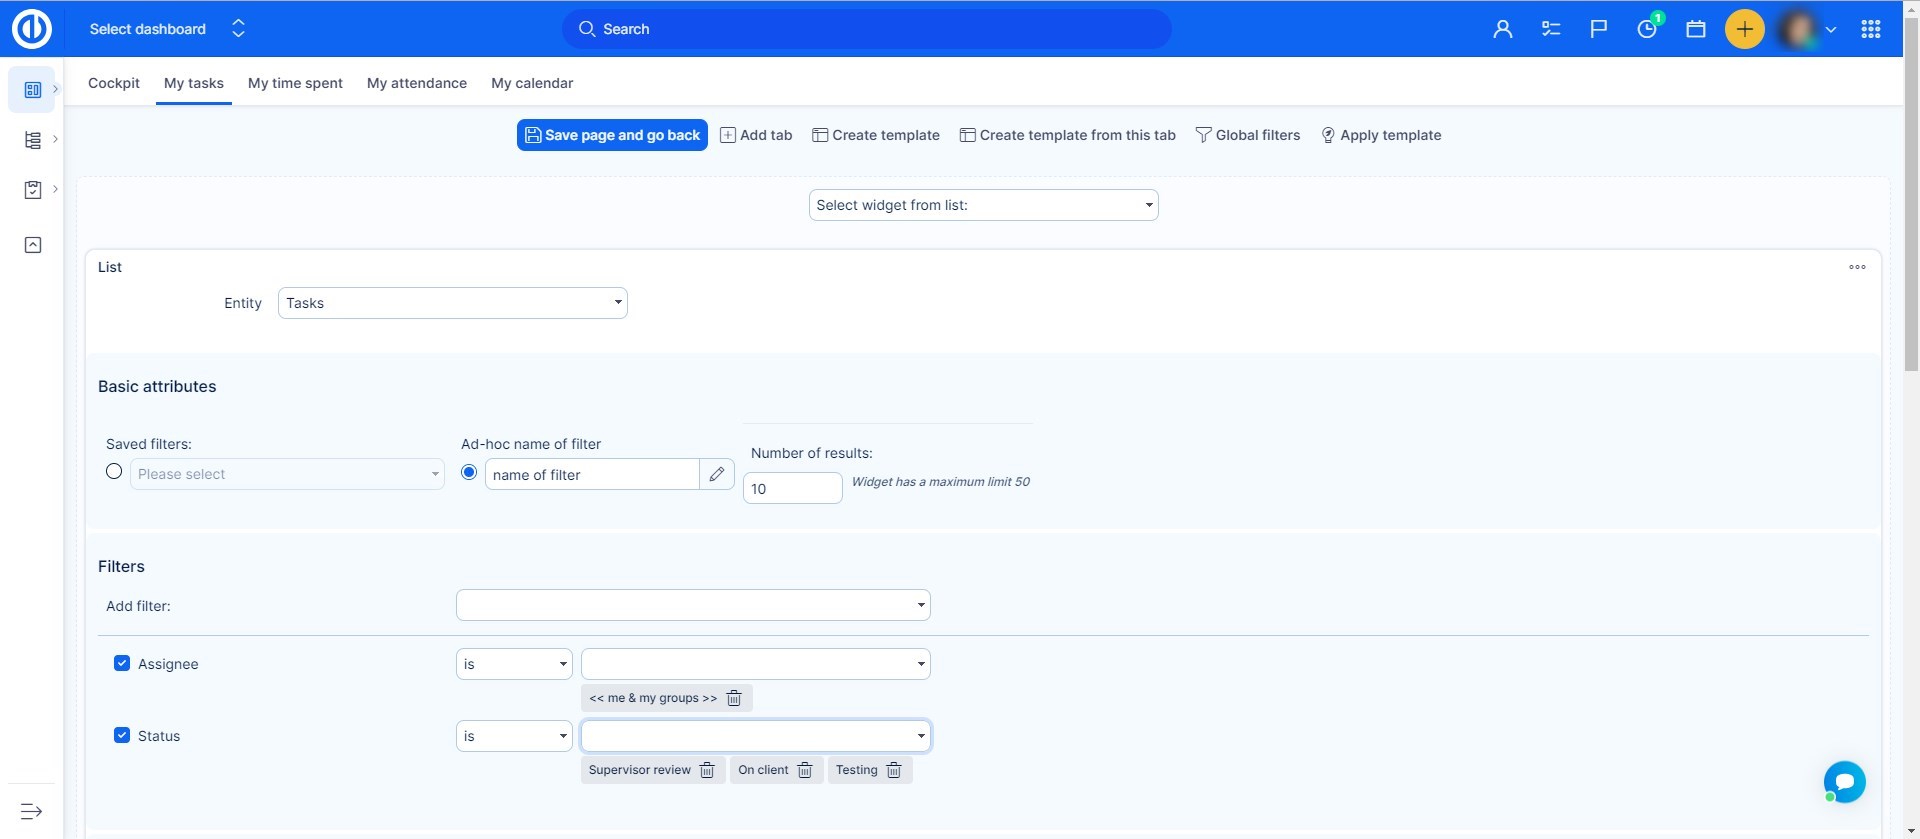
There are more situations where you come across filters in Easy Project, such as dashboard personalization. As you know, you can easily personalize your dashboard by adding, adjusting and removing widgets from the selection. Some of these widgets contain filters to show you sought-after results only. The most common widgets with filter settings are Attendance, Tasks from filter, CRM cases by filter, Documents, Knowledge posts, all Users, and Money widgets . There is also a widgets called Saved filters list where you select which types of private and public filters will be easily accessible directly from your dashboard. The filter settings in dashboard personalization might look like this. After clicking on "Save page and go back" button, you will see clearly filtered data like this.
Filtering with OR operator
A widely requested feature has finally found its way into reality. Please keep in mind that the feature is in an experimental mode, and was tested for relatively simple use cases. The user interface is advanced and currently allows invalid inputs, which may be mistaken for misfunction.
How to use
- Go to Administration >> Settings >> General - Enable Easy Query Language.
- On any list under filters, you will find it as the last item.
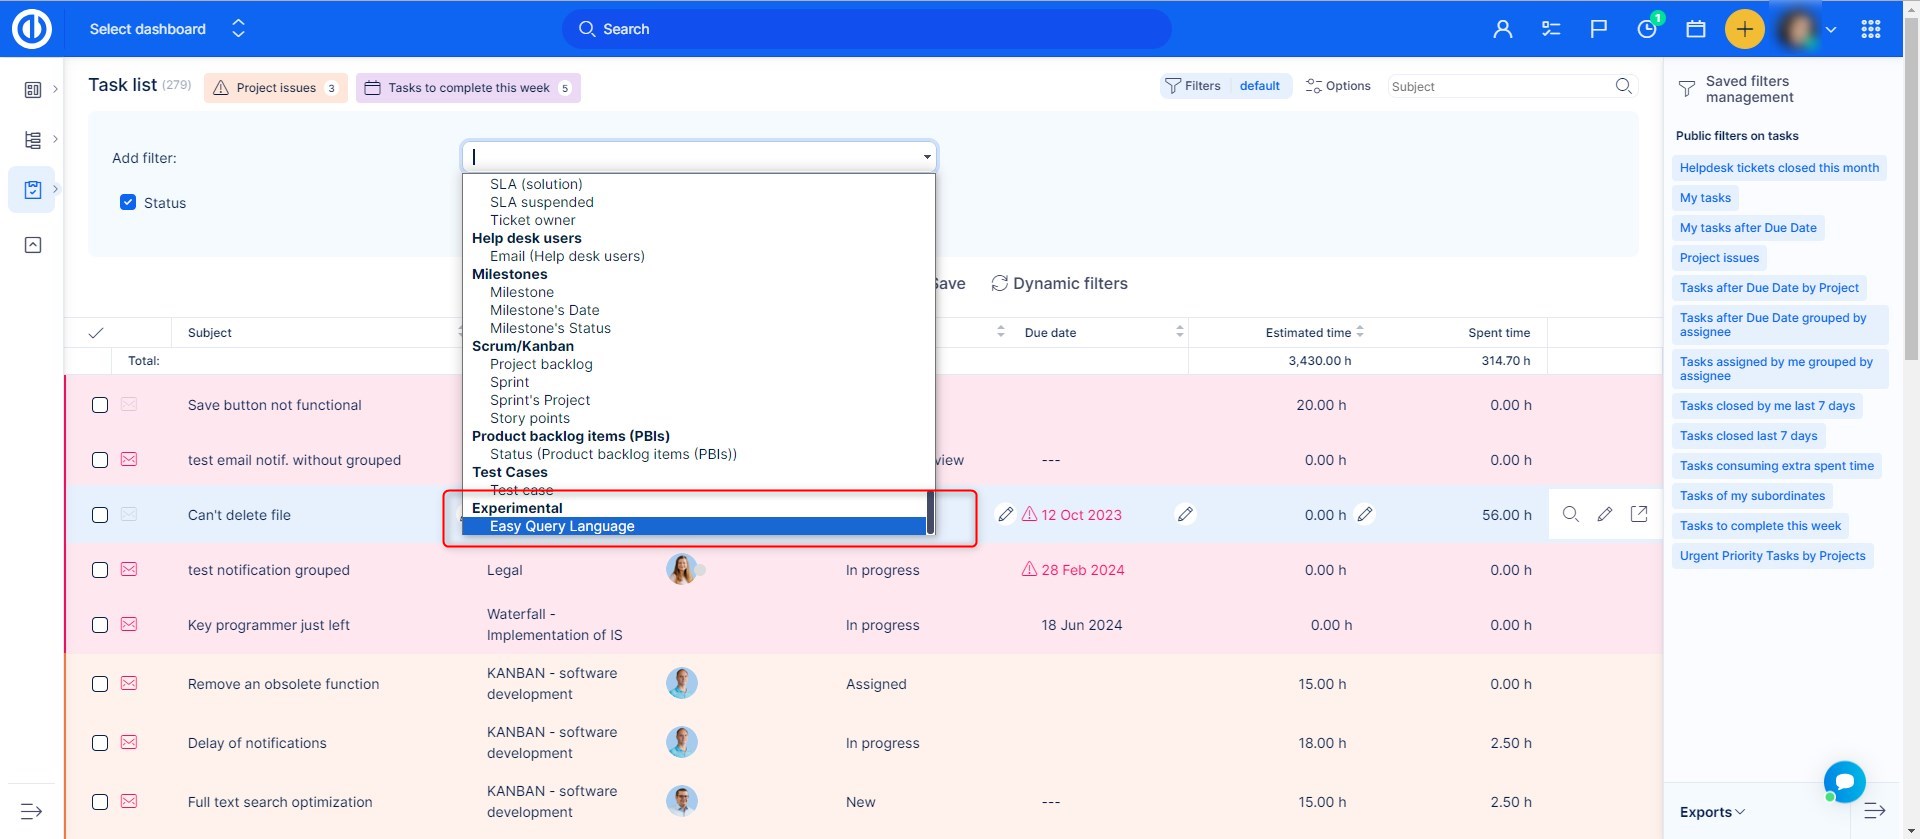
- In this input, enter the attributes and conditions. You will find a tooltip to better understand the syntax under Show help button. By starting typing the filtering attribute, suggestions will appear.
Let's look at an example.

The result of these filters will show open tasks that are either assigned to me or where I am coworker (my user ID is 5). This is actually the most requested use case we received from the community.
Some rules to remember
- Users, priorities, statuses and other enumerated attributes use IDs. If you intend to let your regular users use this feature, you should prepare a reference table for the values and their IDs. You can find the IDs in the database (server solution), or in the URL when editing the attribute.
The ID of status Done in this application is 6. - Combining the custom filter with regular filters is possible and works standardly - with AND operator. Meaning, that my custom filter acts as one condition next to all other filters you choose and resulting items have to comply with all conditions. If used incorrectly, you may set contradictory conditions. For example, in the custom filter, you will have "assignee is me" and, at the same time, you will use the regular assignee filter for a different user. This example will logically have no results. My user ID is 5 and Lukas is my colleague. The task cannot be assigned to Lukas and me at the same time.
The custom filter doesn't contain all the options as regular filters, for example <<me>> filter for users, or open for statuses.
Nevertheless, even with the limitations, we believe this functionality will provide a vast expansion of usability and reporting capabilities.
Options
Apart from filters alone, there are some additional options related to filters, allowing you to configure the columns and style of outputs (results) shown on the screen. Options can be found under the "Options" icon in the top right corner (next to the Filters icon).
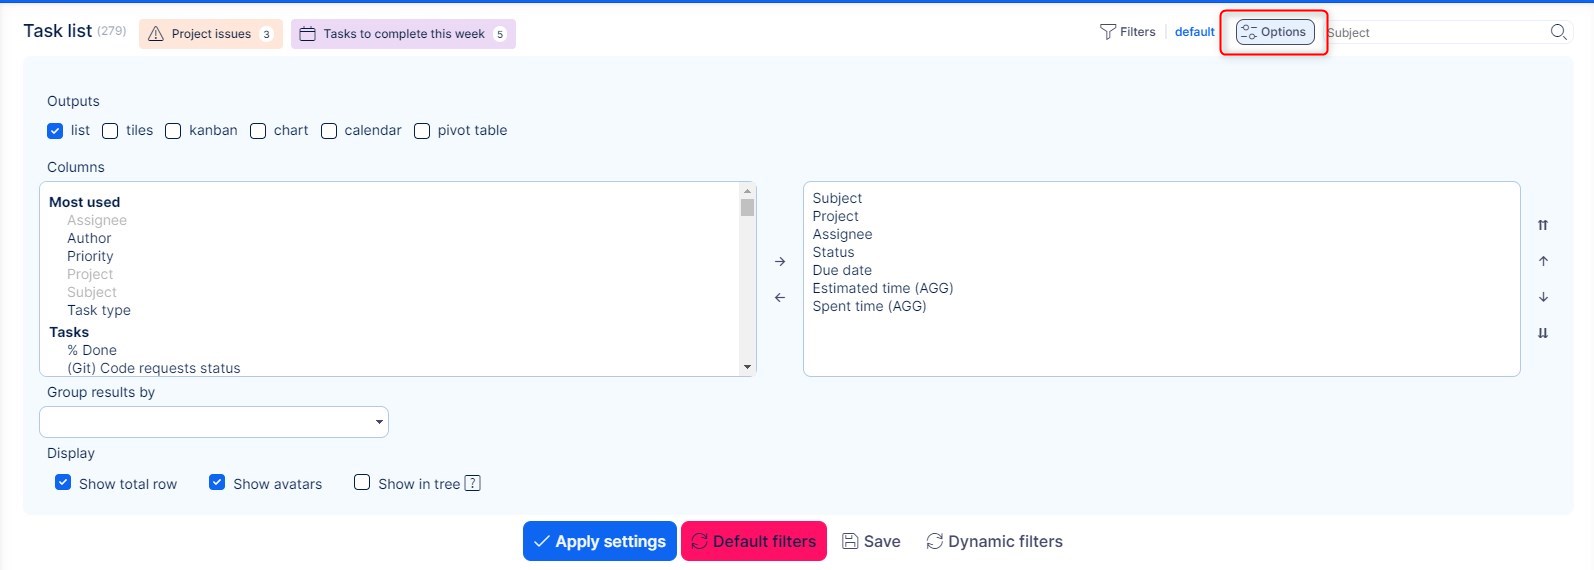
You can select from 4 different types of outputs as follows.
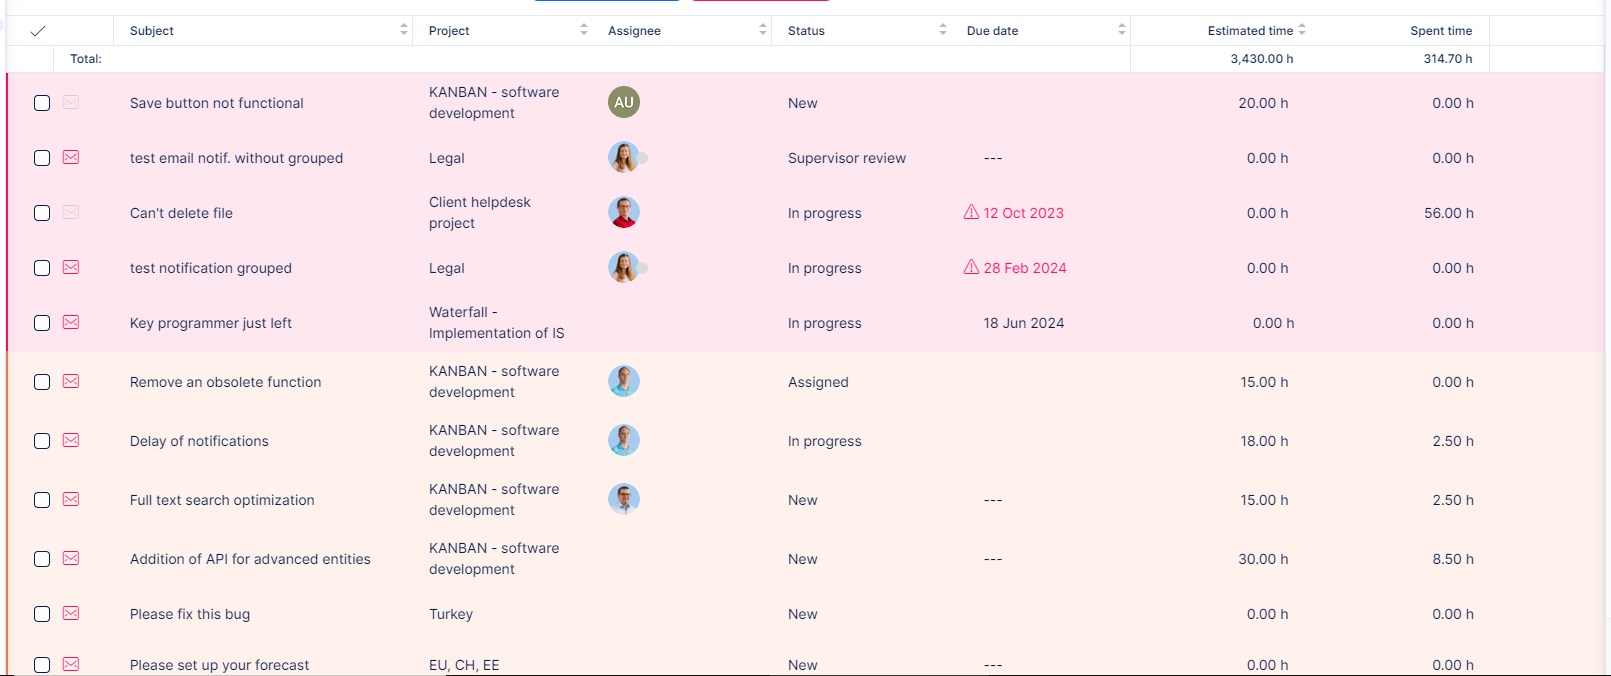
List
This type allows you to see a standard list of results with rows and columns. The rows are determined by the number of items corresponding to the filter settings. Columns can be added or removed in the Options settings, and you can group the results as per various criteria as well.
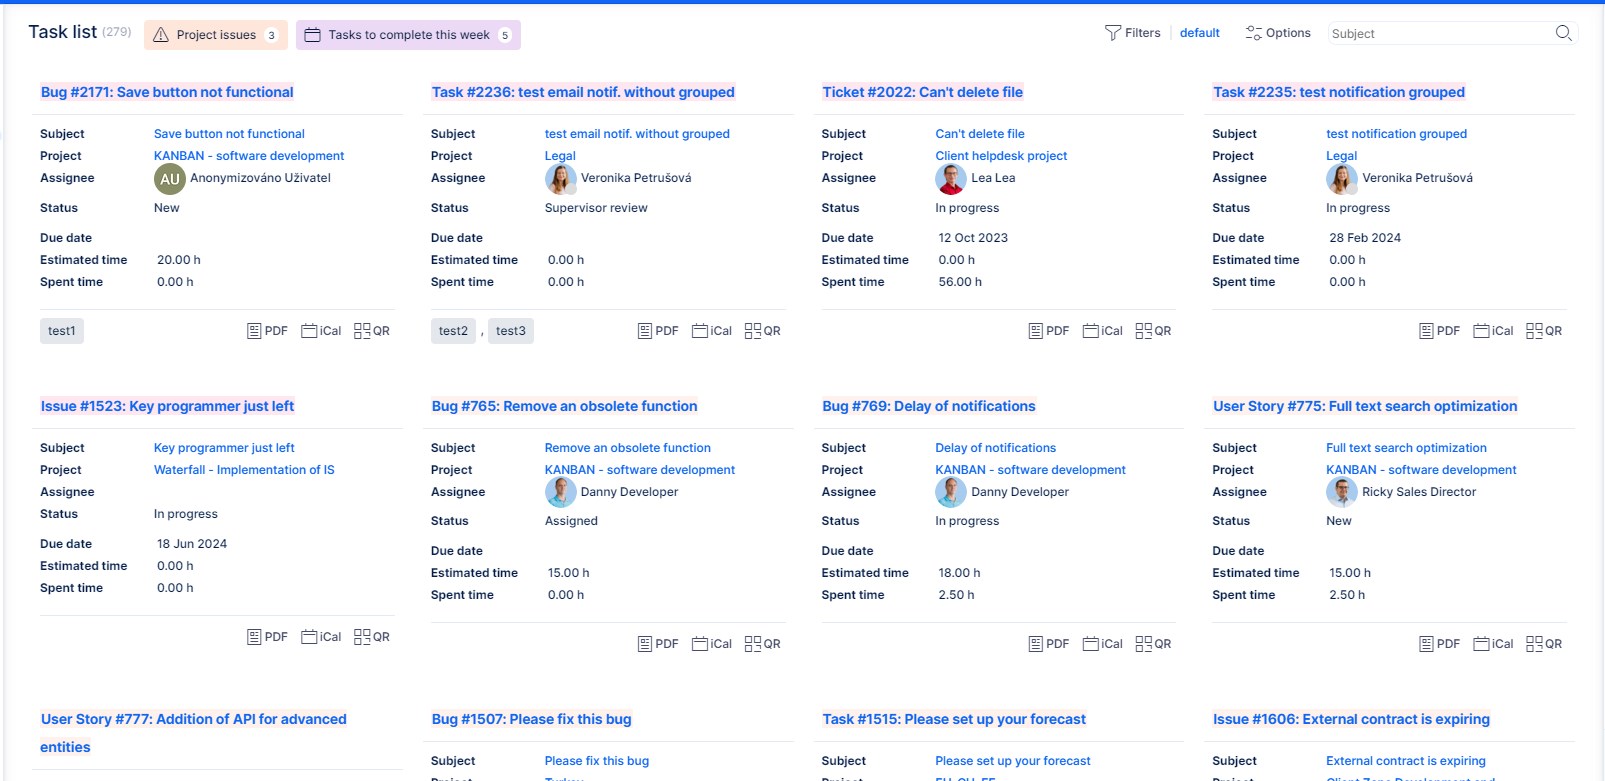
Tiles
This option allows you to see results as tiles. No additional settings are available for this output type.
Chart
This option allows you to see results as a chart with configurable values for X axis and Y axis. As for chart renderer, you can select from line, bar or pie.

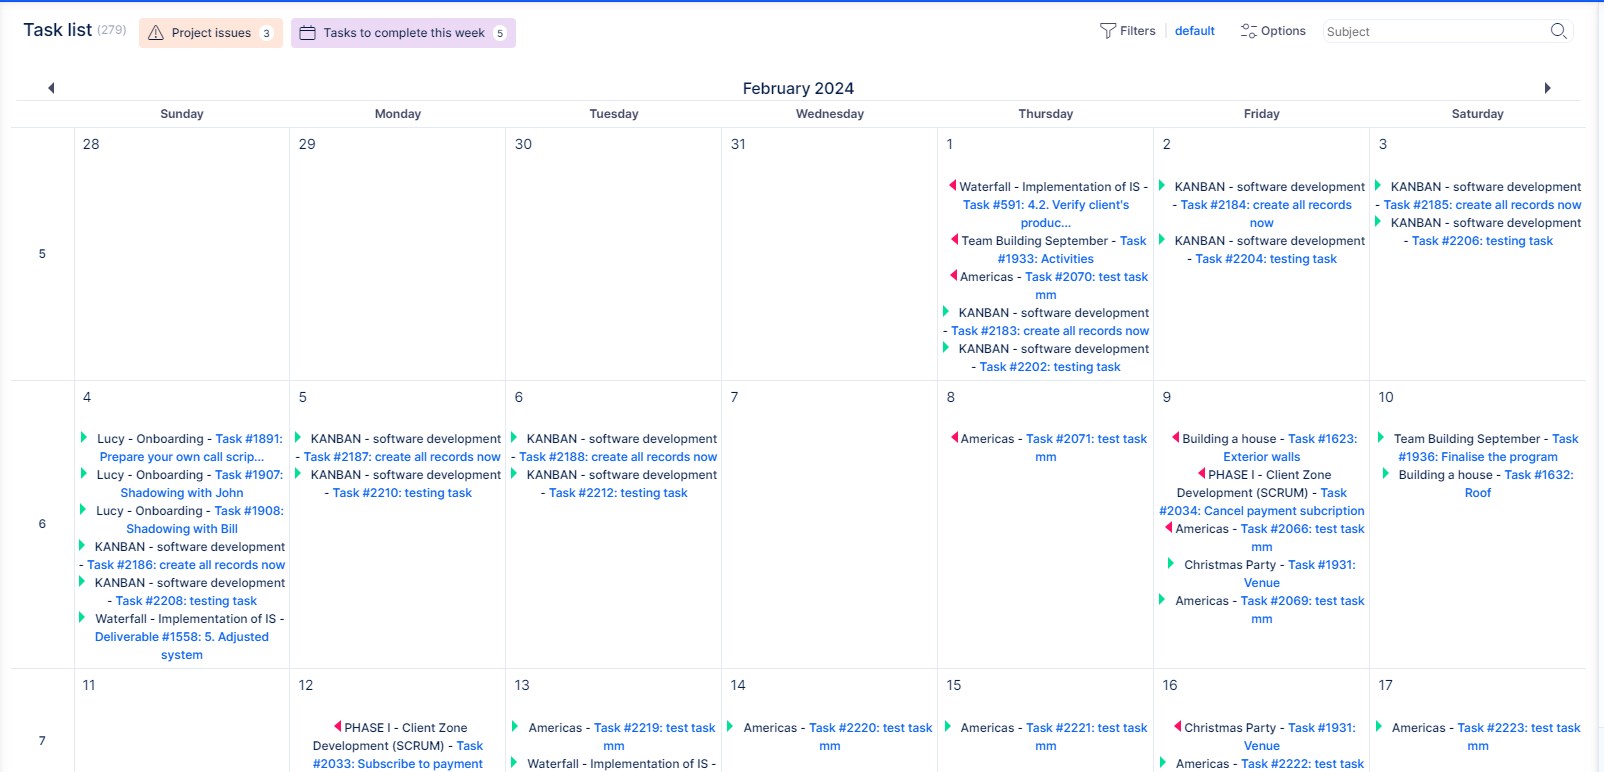
Calendar
This option allows you to see results as a calendar with a configurable time period.
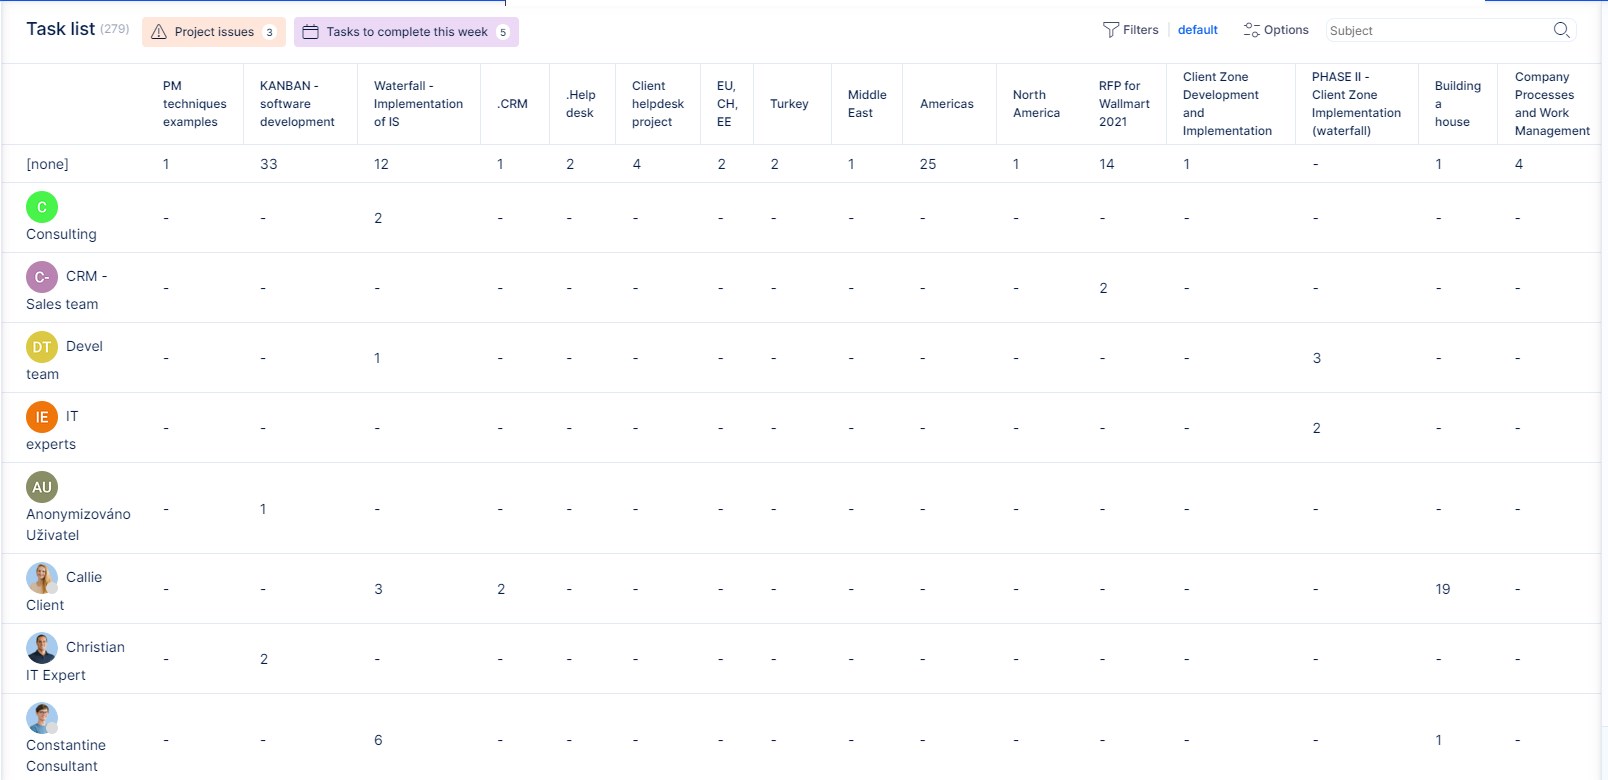
Pivot table
This option allows you to see results as a report, which is basically a pivot table with grouping options both on the horizontal and vertical sides of the table. On the vertical side, you can even group by more than one criteria. Summable column shows configurable variables as per corresponding groups in the rows. Ticking the "Count" checkbox enables to see the number of items in each box in addition to the value itself. This is especially useful with Money plugin and its financial reports, such as Portfolio overview.
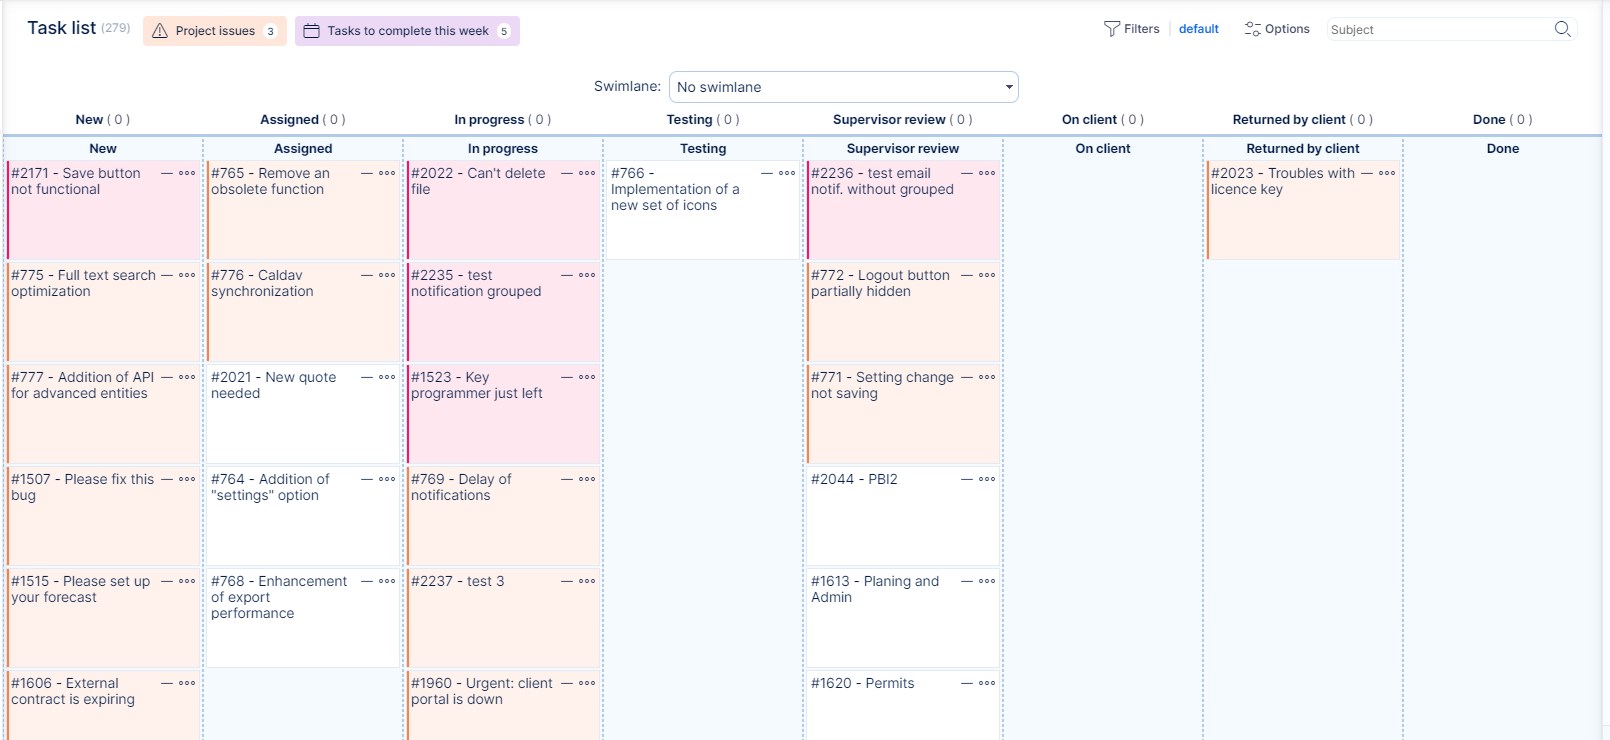
Kanban
This option allows you to see results as a Kanban board with many configurable options.
Corner situations
- When default task sorting is set to sort by parent task, tasks are sorted by the tree structure, thus ignoring any other sorting rules that might be set at the second and third level of sorting in default filter settings.
- If a project list is sorted by some parameter (for example names), then it cancels the tree structure view. This can be changed in default project filter settings (/easy_query_settings/setting?tab=easy_project_query)
- If a filter is applied to the tree view of projects, the total row only shows sums of projects that fit the filter (such as estimated time or remaining time), not all projects in the view. The reason is, that to show the relevant projects, you also need to show their parent projects (which may not fit the filter).
When you are on a project list and need to filter only those projects where a user has a certain role, use the combination of two filters:
- Project members is: (username)
- Role is: (select one or more roles)
Limitations and exceptions
- "Show avatars" function does not work on Easy Gantt because the list must be modified for a better graphical view.
- "Show avatars" function is usable for lists containing any native field where you select a user (not in a custom field of "user" type nor lookup field over users).
- "Load groups opened" function works for grouped lists, thus you must have selected the attribute "group results by" - the same applies to the project list - if you do not have grouped projects, they will appear in the tree that is closed by default.
- Exporting options in the lower right corner only work for List view, not for other display options such as tiles, chart, calendar, and report.
- If you set the default filter, the output will always be in the list format, even though you have other output formats set in that filter. This due to performance reasons - charts load longer in general and this should not be in default view.
- If the filter output is a chart showing data for a selected time period, changing the time unit in the top right corner of that chart (day, week, month, quarter, year) will cancel the currently displayed time period and show the default period instead.
- Saved Filters Management only supports listed outputs (output type = List), not any other types of outputs like charts. That means that only lists (and nothing else) can show up when you apply a saved filter.
- "Show total row" option does not display sums for "Total estimated time" and "Total spent time" because sums of totals would show higher than actual numbers (due to double counting of subtasks). Therefore, use the sums of "Estimated time" and "Spent time" instead.
- The currently applied filter on the task list is not remembered after going to another tab of Easy Project due to performance reasons. On the other hand, filters applied on other pages always restore since the performance drop is not so significant in this case.
- "Group by" option only works with the List output format. If applied to other types of output, no data will be shown.
- The maximum number of characters allowed to be in URL when creating and using filters is 1024*10. Any URL length over the limit will probably end in 414 error.
- Filters saved for projects and subprojects: Filter is only visible when checkbox "For all projects" is enabled, or if project is directly project where is user assigned. Filter is not visible when checkbox "For subprojects" is enabled. If you have query for project, you have to permissions for them. Only for subprojects it is not enough.¨
- With larger numbers of results, the bottom side to side scroller might be not visible. To scroll from left to right use SHIFT + scroll, or you can also disable automatic loading on a user profile. This can be found under the preferences tab. User >> Edit - Disable automatic loading
