en
Language
  • en
  • cs
  • hu
  • it
  • es
  • fr
  • de
  • ru

Business Dashboards

Business dashboards consist of three main features - global filters above dashboards, graphs and charts with click-through functionality, and trends. With global filters, a user can apply a filter to all or just selected modules on a personalized page together in just two clicks. Graphs and charts can be configured to show a specific page (dimension) upon a click on the chart values. Moreover, trends give you real-time values and trends overview just after one glance on a dashboard.

Key Features:

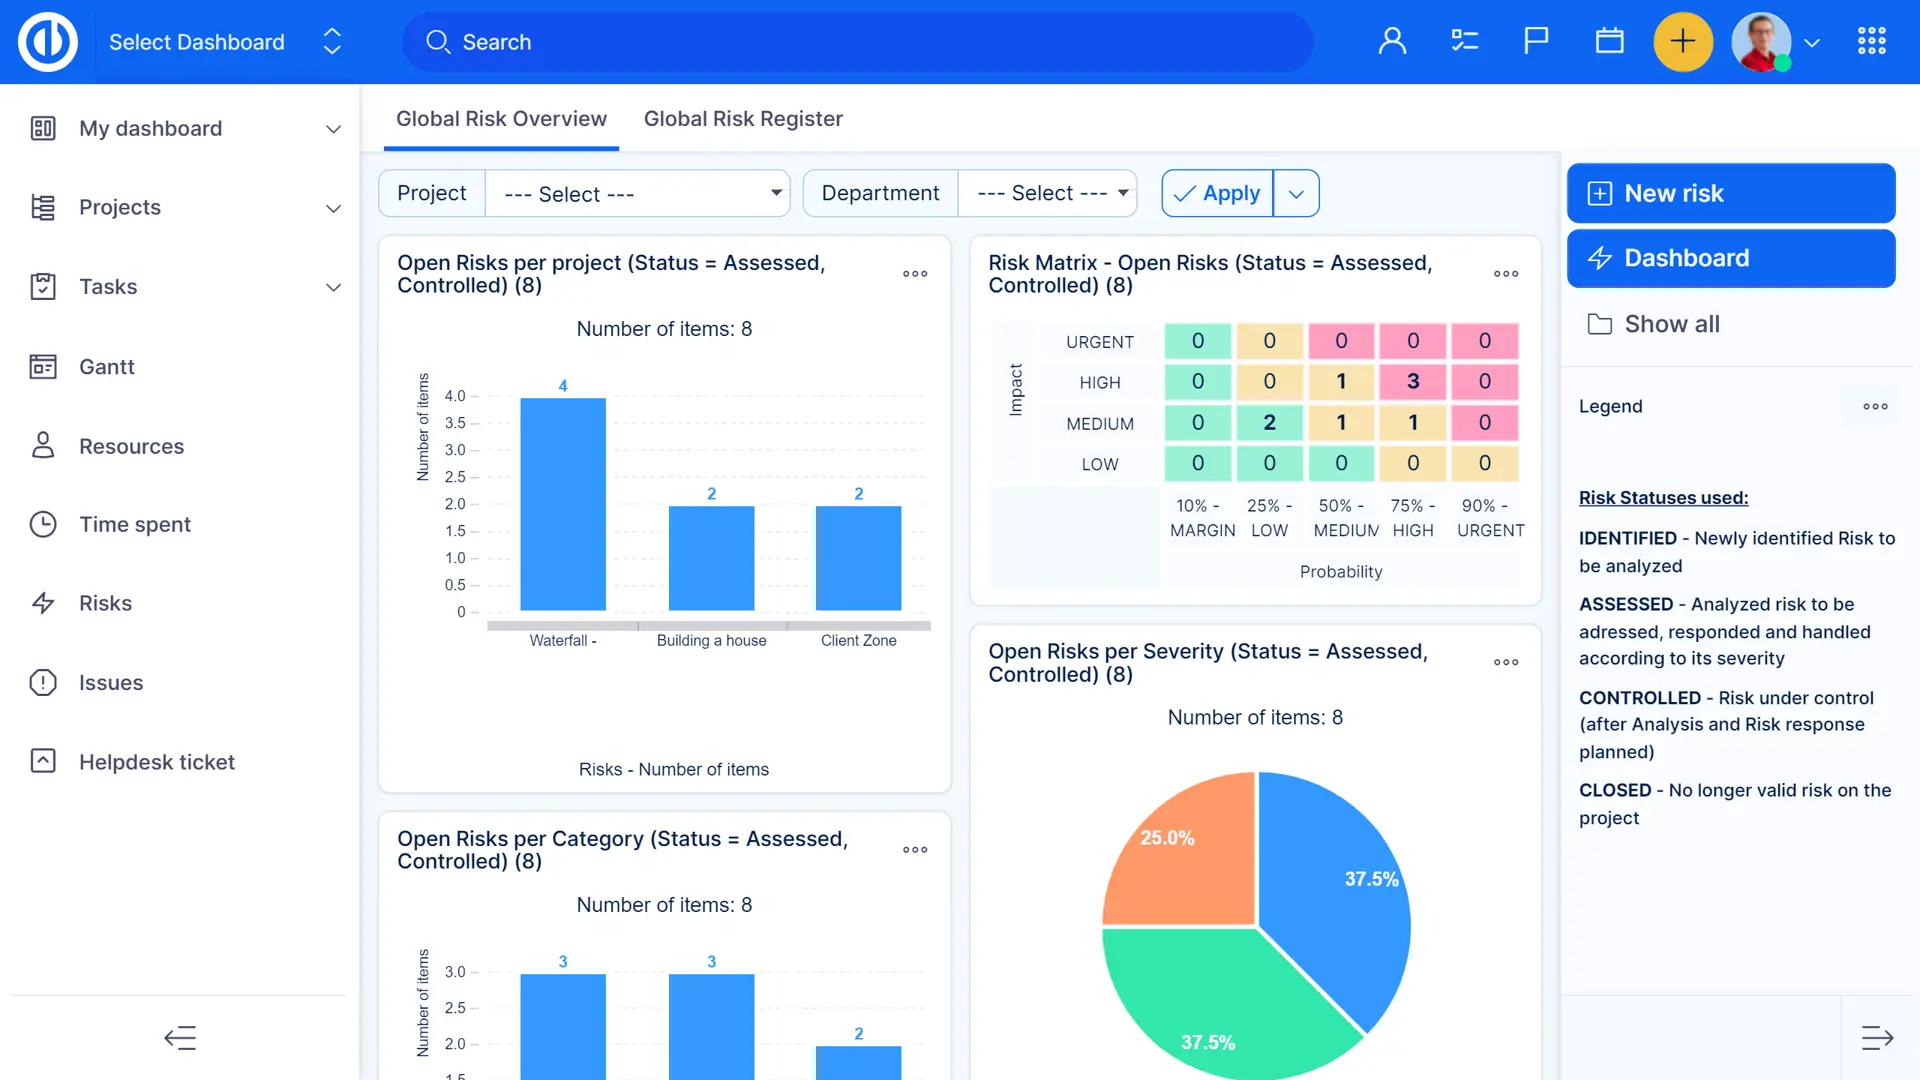
  • Global filters above dashboards – all modules on dashboard are filtered together

  • Graphs and charts with click-through drill down to other dimensions

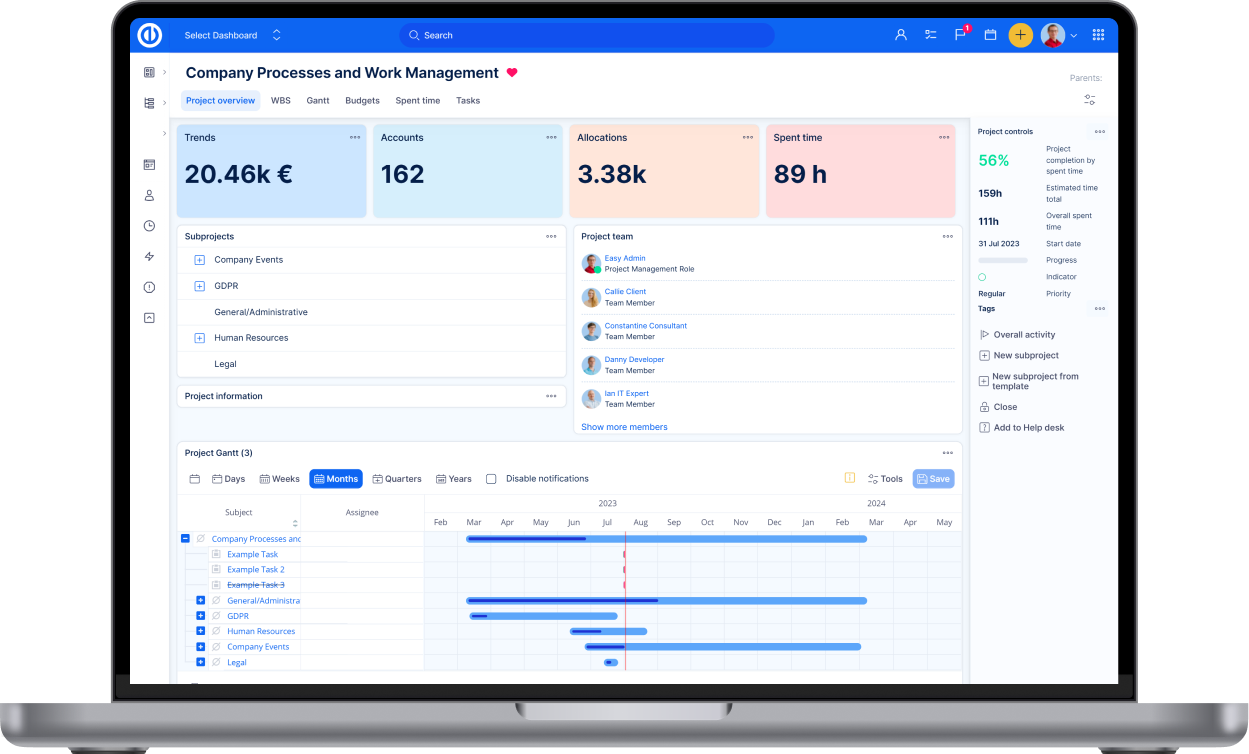
  • Trends with automatic comparison to the previous period

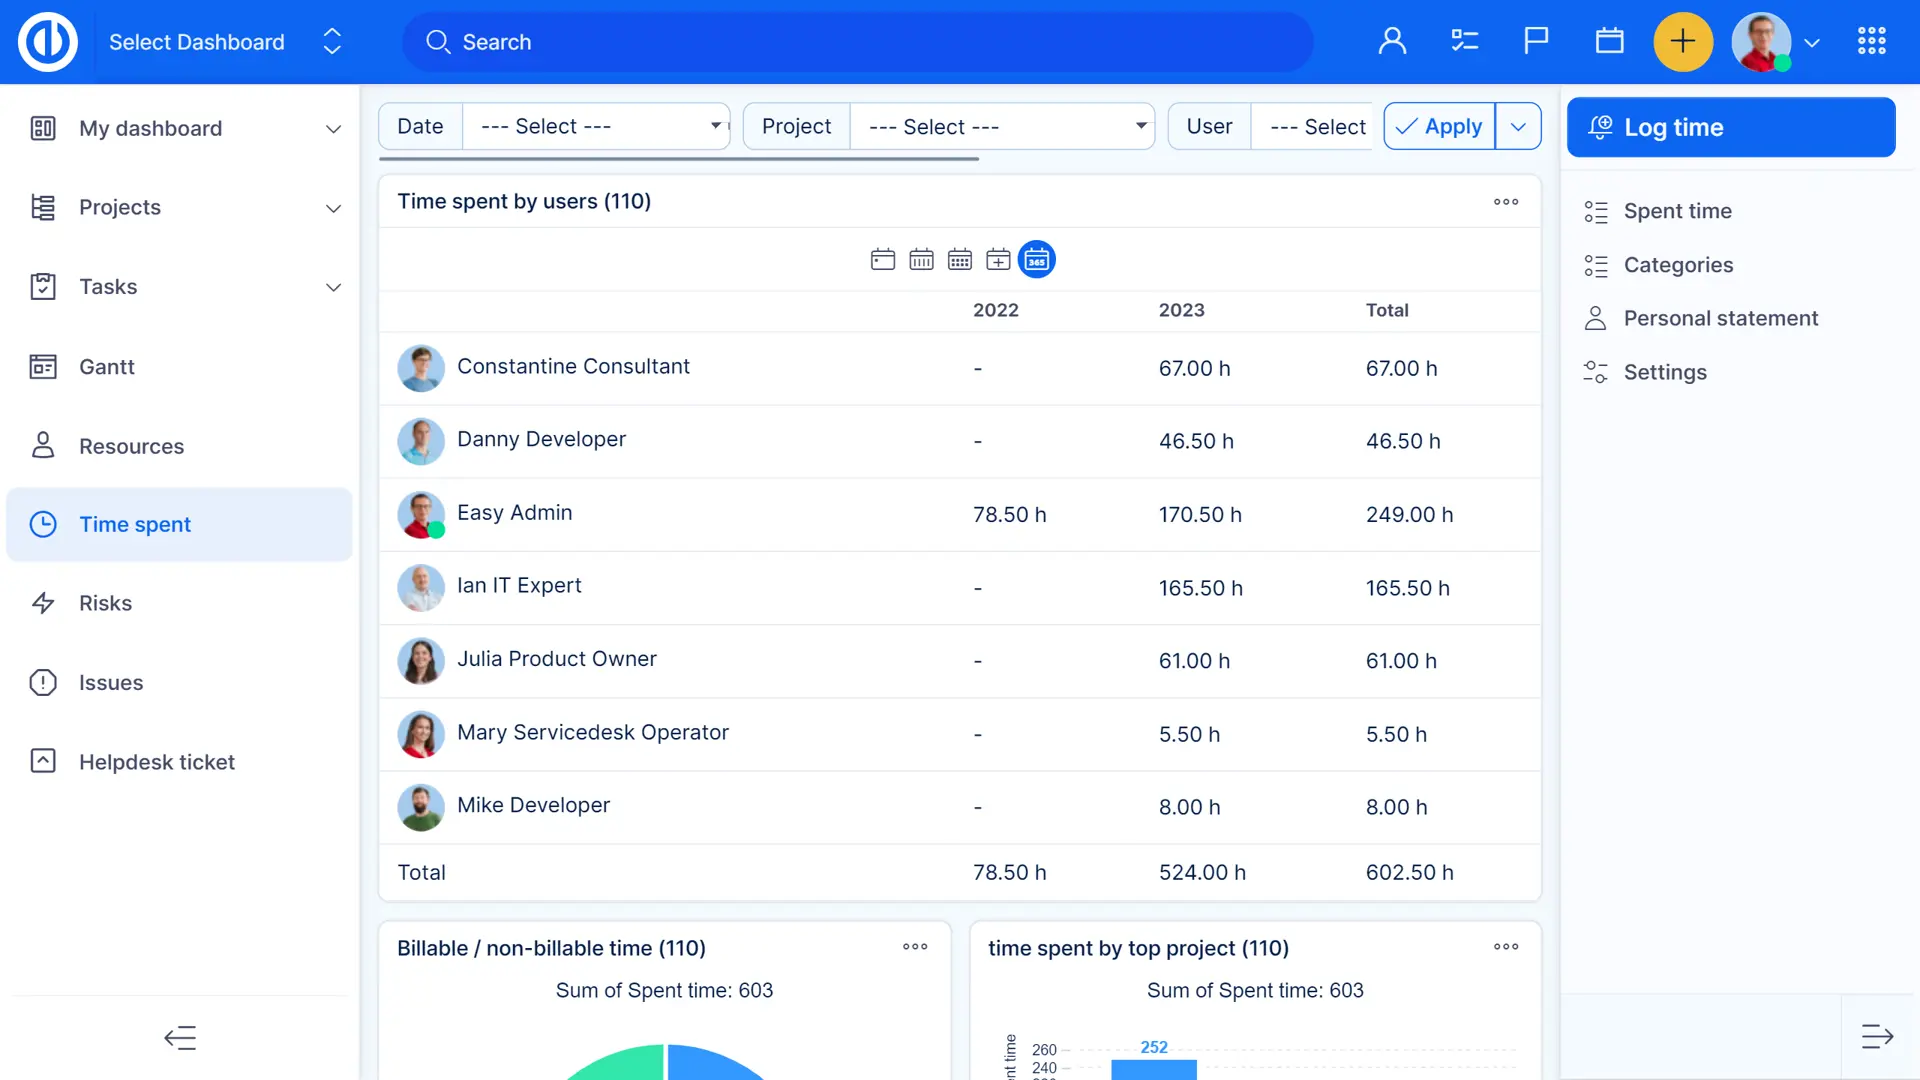
  • Continous awareness of current performance

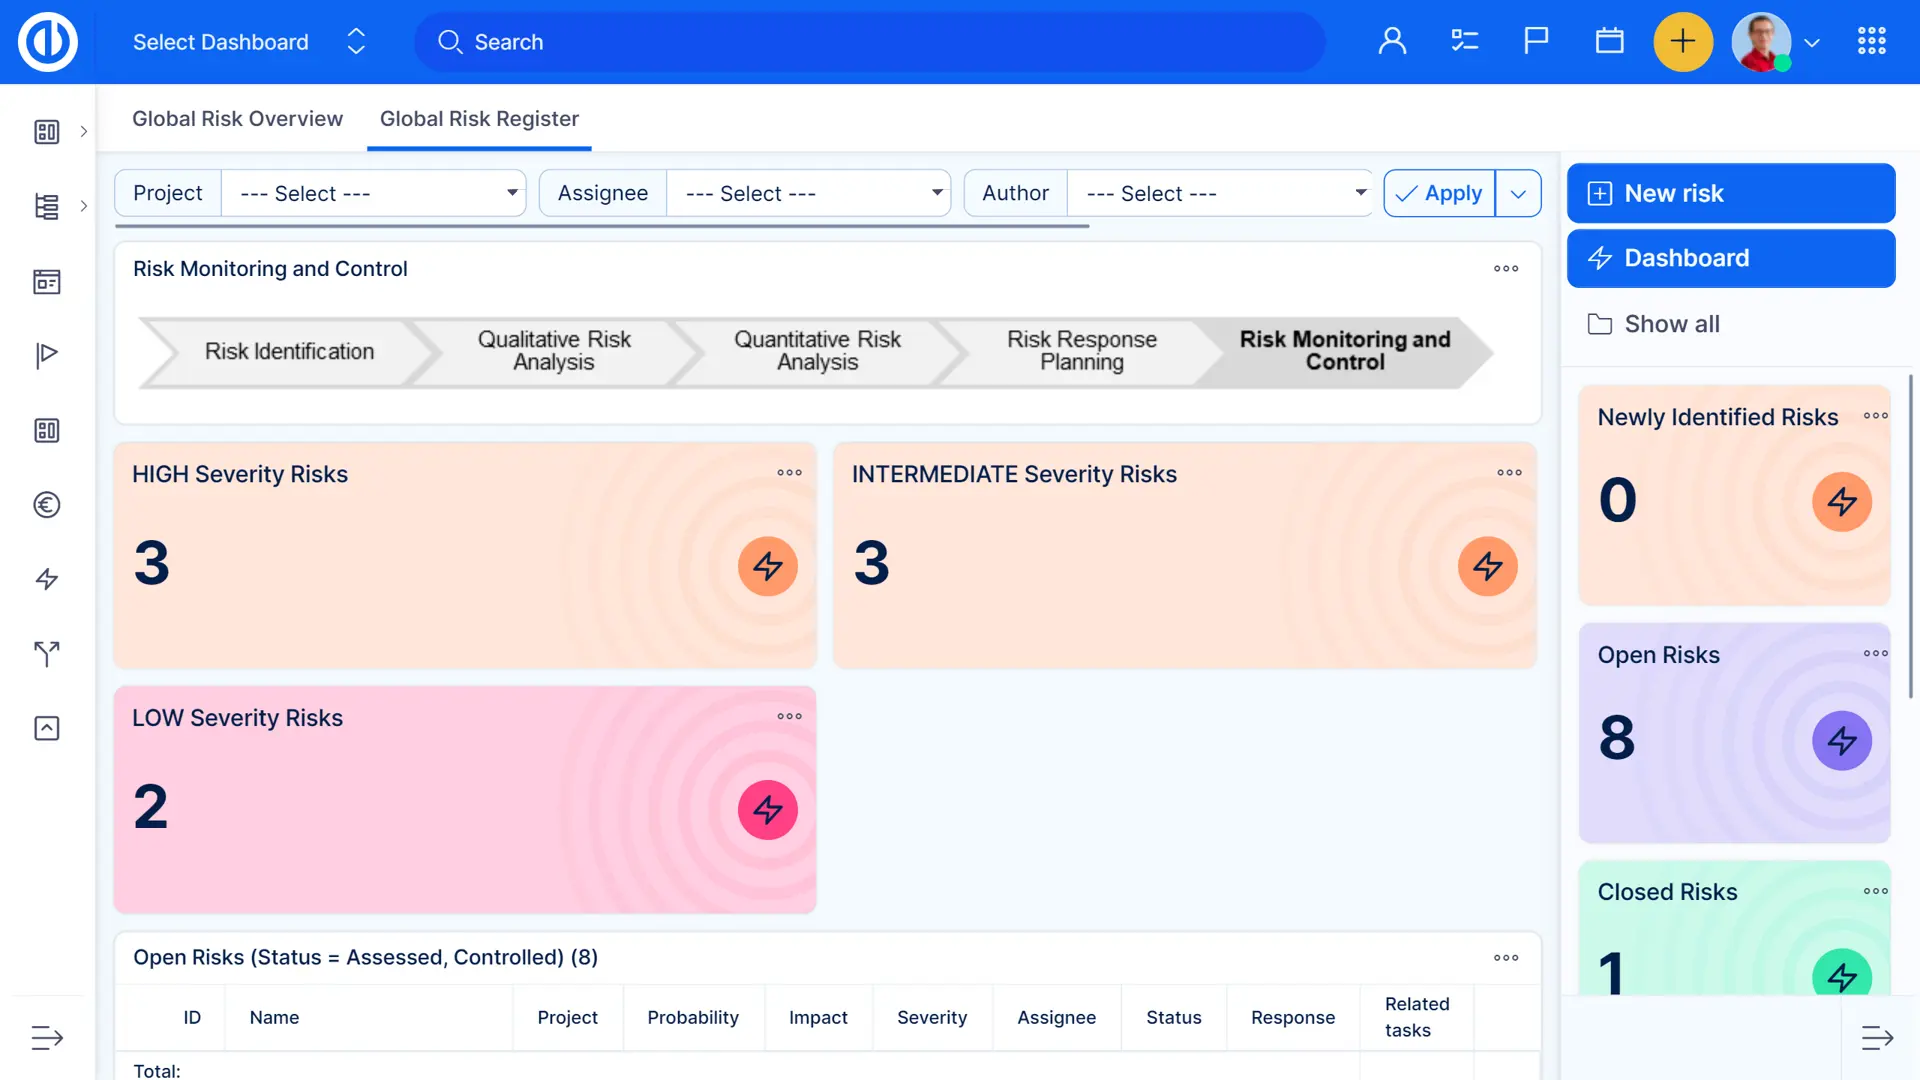
  • A global-level module

All-in-one project platform

Combine project management, tasks, ITSM, and source code management in a single unified software.

AI-powered

Enhance productivity with secure, on-site AI that summarises, and transforms notes into actionable tasks.

Data protection

Choose on-premises deployment or utilise an ISO-certified cloud. Open-source code audits guarantee exceptional security for your intellectual property.

Reporting and data insights

Use Easy Project's real-time, flexible reporting tools to make informed decisions.

Product

Easy Project redefines your technology projects

  • All-in-one platform powered by Easy AI.
  • Combines hybrid project management, IT service management, and source code management.
  • Trusted by over 1,000 satisfied technology services and enterprise customers.
  • Simplifies the management of complex projects and ensures smooth post-delivery support.
  • ​Customizable project management software tailored to your organization's unique needs.

Trusted by the best

Try Easy Project in 30 days free trial

Access all features, SSL protected, no credit card required.